Bloat in the Federal Public Service: Justin Trudeau Ranks Last among Canadian Prime Ministers over the Past 40 Years

Economic Note ranking the five major prime ministers who have held power since 1984 based on the variation in the number of federal public servants per 1,000 inhabitants during their mandates
 Related Content
 |
|
 |
| Size, cost of civil service out of control under Trudeau government, report finds (Toronto Sun, January 25, 2024)
Trudeau «a perdu le contrôle sur la croissance de l’État» (Le Soleil, January 25, 2024) Justin Trudeau on ‘unmatched’ hiring spree, unlike any PM since his dad (Western Standard, January 25, 2024) Unprecedented surge in public servants fails to boost service quality for Canadians (Troy Media, January 26, 2024) |
Federal government needs to go on a diet (Sun Media Papers, February 4, 2024)
Le gouvernement fédéral doit se mettre au régime (IEDM.ORG, February 5, 2024) Report finds ‘unprecedented expansion’ of the public service under Trudeau as ratio of public servants to population has increased by 25.3 per cent (The Hill Times, February 6, 2024) |
Interview with Renaud Brossard (Shaye Ganam, Global Radio, January 25, 2024)
Interview with Renaud Brossard (Conversation That Matters, March 22, 2024) |
This Economic Note was prepared by Gabriel Giguère, Public Policy Analyst at the MEI. The MEI’s Taxation Series aims to shine a light on the fiscal policies of governments and to study their effect on economic growth and the standard of living of citizens.
Over the past few decades, the number of employees in the federal public service has fluctuated somewhat with the mandates of successive governments. Under Justin Trudeau’s current government, however, we are witnessing a truly unprecedented expansion in the size of the civil service.(1) The present study provides a ranking of prime ministers’ performances over the past forty years in order to put the size and evolution of the federal public service into perspective.
An expanding public sector comes with consequences. It can generate a number of adverse effects on a country’s economy, including undue competition with private-sector employment that can exacerbate labour shortages.(2) This can hold back productivity growth,(3) because, for a number of reasons,(4) public-sector employees are often less productive than those in the private sector. In comparison with other G7 countries, Canada is no stranger to low productivity growth.(5)
An expanding public sector can generate a number of adverse effects on a country’s economy.
A bloated civil service workforce naturally puts upward pressure on personnel and operating costs, as we are currently seeing in Canada.(6) This increased spending must ultimately be paid for by higher taxes. For all these reasons, political decision-makers must maintain consistent control over the size of the state and over the number of civil servants who manage it on a day-to-day basis.
Change in the Public Service Workforce from Mulroney to Harper
In order to analyze the size of the federal public service, we employ two key metrics: i) the absolute number of employees, and ii) the absolute number of employees per 1,000 inhabitants of Canada, the latter measure taking into account population growth.
The Mulroney Years (1984–1993)
When Brian Mulroney’s Progressive Conservative government came to power in 1984, it found that it had inherited a rather unenviable situation: under previous governments, the number of public servants had risen to over 253,000. This number remained fairly stable under Mulroney’s watch, seeing only a modest reduction of about a thousand positions over his term in office (see Figure 1).

However, as Canada grew, the number of civil servants relative to its population fell faster than it had under any other government, from 9.9 employees per 1,000 inhabitants down to 8.9 (see Figure 2). The extremely high ratio at the start of Mulroney’s mandate—higher than any in the four decades that followed—was the legacy of his Liberal predecessor, Pierre Elliott Trudeau.(7)

The Chrétien Years (1993–2003)
When Jean Chrétien came to power in late 1993, an explosive increase in debt servicing was threatening the stability of public finances. He thus began his mandate by adopting a rigorous approach to the budget that included slashing the workforce of the federal public service by almost 38,000 people during his first term, an impressive 15.6% reduction.
The Trudeau government has increased the headcount of the federal public service by 37.9%, and the ratio of public servants per 1,000 inhabitants by 25.3%.
However, the number of civil servants began to rise again during his second term. By the time he left office in 2003, there would be just 3,500 fewer civil servants than when he had taken power ten years earlier, but this would still correspond to a 9.7% drop in the number of federal civil servants per 1,000 inhabitants.
The Martin Government (2003–2006)
There would be no major fluctuations in the size of the federal public service under Paul Martin’s Liberal government, which was in power for just over two years.
The Harper Years (2006–2015)
Over the nearly ten years of Stephen Harper’s Conservative government, the size of the public service initially rose considerably—by around 33,000—before falling back and finishing with around 7,100 more positions than in 2006. However, taking into account the growth of the population during the period, this nevertheless translated into a decrease in the relative size of the federal public service from 7.7 to 7.2 employees per 1,000 inhabitants.
Change in the Public Service Workforce under Justin Trudeau
The relative stability of the absolute number of federal public servants over the preceding thirty years was shattered when Justin Trudeau’s Liberal government came to power in 2015. From just under 260,000 at the start of his mandate, the number of public servants began to rise quickly, and by March of 2023 it had reached 357,247. On an annual basis, staff increases in government agencies and departments ranged from a few thousand at the start of his tenure to 21,290 between 2022 and 2023.(8)
Political choices favouring rapid expansion in the size of the state and the public service have thus led to the addition of nearly 100,000 civil servants in just eight years of power. The Trudeau government has increased the headcount of the federal public service by 37.9%, and the ratio of public servants per 1,000 inhabitants by 25.3%. If the current rate of growth were to continue, the workforce would reach over 386,505 by 2025, representing an almost 50% increase in the federal public service in just 10 years.
This sharp increase puts upward pressure on public spending and debt, something that must eventually result in heavier burdens for Canadian taxpayers.
When Justin Trudeau came to power in 2015, the number of federal public servants relative to the population was close to the historical average.(9) Since then, his government has increased this ratio at an unprecedented rate, a trend that suggests a loss of control over the size of the state.
Moreover, this expansion of the workforce entails additional spending, which requires additional public debt, ultimately leading to increased fiscal pressure on Canadian taxpayers. Between 2015 and 2022, federal personnel costs rose by 53%(10) to $60.6 billion.(11) Canada’s gross debt also grew at a very high rate over this period, increasing almost 50% after adjusting for inflation.(12)
Ranking the Prime Ministers
Our classification ranks the five major prime ministers who have held power since 1984 based on their performance in controlling the size of the public service for the indicator employed, namely the variation in the number of federal public servants per 1,000 inhabitants(13) (see Table 1).

To summarize:
- First place goes to Brian Mulroney. Under his government, we saw the biggest decrease in the number of federal public servants per 1,000 inhabitants, a drop of 10.2%.
- Second place goes to Jean Chrétien. Sound management of public finances enabled him to reduce the number of public servants relative to the Canadian population by 9.7%. He would have taken first place had he not raised the ratio with a resumption in hiring during the second half of his mandate.
- Third place goes to Stephen Harper. Despite a slight increase in the absolute number of government employees, the total per 1,000 inhabitants declined 6.3% by the end of his mandate.
- Fourth place goes to Paul Martin. During his relatively short mandate, he maintained a steady equilibrium between public service human resources and population growth.
- Last place goes to Justin Trudeau. He pushed the number of federal public servants per 1,000 inhabitants to a 30-year high, increasing it by a substantial 25.3%. In recent decades, no prime minister has come anywhere close to Trudeau’s increases in the size of the federal public service.
Conclusion
After remaining relatively stable for decades, the number of federal public servants is now rising rapidly under the Trudeau government. In addition to its repercussions for economic factors such as productivity, this sharp increase also puts upward pressure on public spending and debt, something that must eventually result in heavier burdens for Canadian taxpayers.
Though the COVID-19 pandemic may have affected the hiring of civil servants, it is not the primary factor explaining the increase in the number of federal employees. The rate of growth in the federal workforce was already high in 2019 and this has been sustained right through 2023 at a pace unmatched at any point in the preceding forty years.(14)
The rising trajectory of the magnitude of the government’s labour force requires a new approach. This should begin with a thorough analysis of the necessity of every government position with a view to reducing the size of government (and its associated personnel costs) the way the Chrétien government did in the 1990s.
References
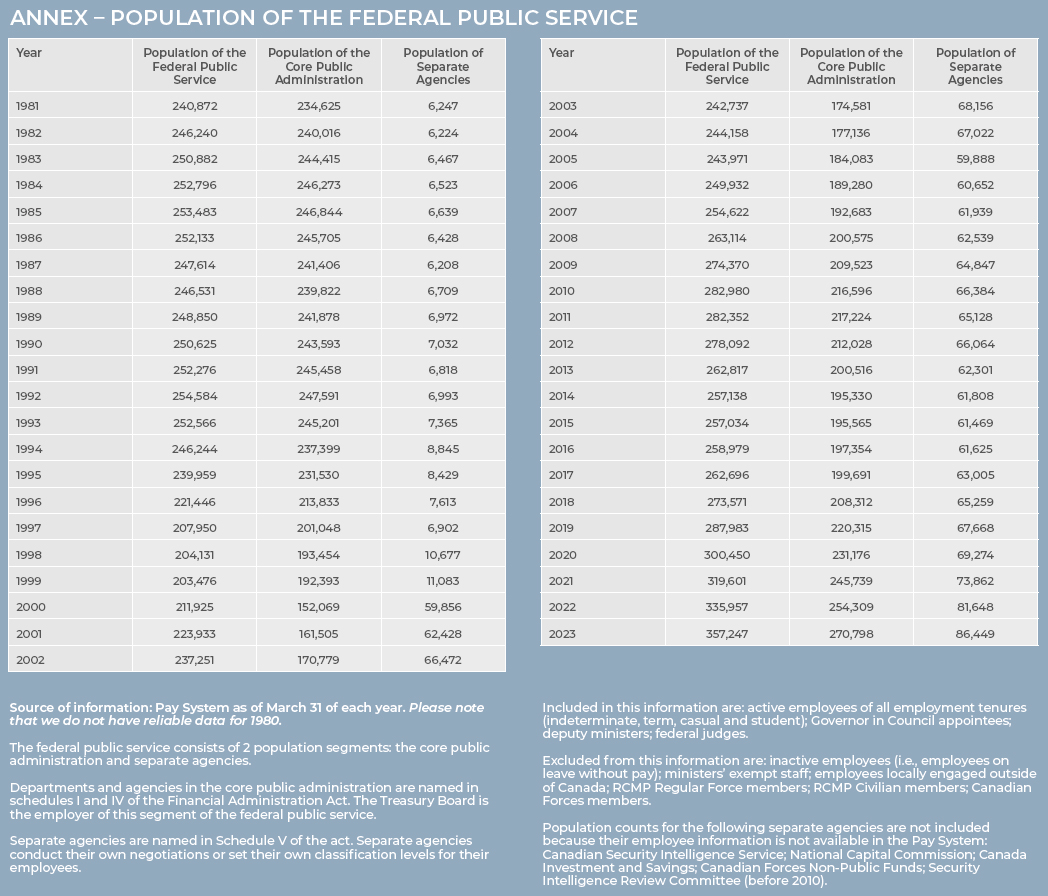
- Treasury Board of Canada Secretariat, Population of the Federal Public Service, Government of Canada, consulted December 15, 2023; We use the government’s calculation of the federal public service workforce.
- Alberto Behar and Junghwan Mok, “Does Public-Sector Employment Fully Crowd Out Private-Sector Employment?” International Monetary Fund, June 2013, p. 4.
- Horst Feldmann, “Government size and unemployment: Evidence from industrial countries,” Public Choice, Vol. 127, Nos. 3-4, 2006, p. 452.
- Matthew Dimick, “Compensation, Employment Security, and the Economics of Public-Sector Labor Law,” University of Toledo Law Review, Vol. 43, Spring 2012, p. 548.
- Renaud Brossard, “Lagging Productivity: A Threat to Canadian Living Standards,” MEI, Viewpoint, August 10, 2023.
- Office of the Parliamentary Budget Officer, “Personnel Expenditure Analysis — Update,” April 2023, p. 1.
- Ignoring John Turner’s very brief mandate, which lasted less than three months.
- Author’s calculations. Treasury Board of Canada Secretariat, op. cit., endnote 1.
- 2015 was the 6th best year for this indicator, out of the 38 that we analyzed.
- Adjusted for inflation, the increase in personnel costs is 32%; Author’s calculation. Statistic Canada, Table: 18-10-0004-01 – Consumer Price Index, monthly, not seasonally adjusted, December 19, 2023.
- Office of the Parliamentary Budget Officer, Personnel Expenditure Analysis Tool, Consulted December 15, 2023. This amount could take into consideration certain employees of the federal public administration who are not included in the count made by the Treasury Board of Canada Secretariat.
- Nathalie Elgrably, “Federal Government Deficits and Debt: Should We Be Worried?” MEI, Economic Note, pp. 2–3.
- The years attributed to each prime minister are those in which each was in power. For election years, with their inevitable overlap, the year was assigned to the person holding the office on March 31.
- See Annex.