Encouraging Entrepreneurship: Billions of Dollars of Subsidies or Tax Cuts?

Research Paper evaluating the effect of personal income tax rate increases on entrepreneurship in Canada between 2016 and 2020, and putting the financial impact of these rate hikes in perspective
Income tax increases since 2015 have impeded the creation of thousands of businesses, shows this MEI study. Federal revenues collected by Ottawa’s most recent tax hike are equivalent to the entirety of production subsidies promised to Volkswagen and Stellantis.
 Related Content
 |
 |
 |
| Montreal Economic Institute says Trudeau Taxes since 2015 are damaging the economy (Ottawa Life Magazine, September 21, 2023)
High tax rates crush the dreams of thousands of aspiring entrepreneurs (Troy Media, September 21, 2023) Tax increases prevented creation of 12,000 new businesses: MEI (The Suburban, September 24, 2023) Study finds Trudeau-era tax hikes prevented 12,000 new businesses (Western Standard, September 24, 2023) |
This Research Paper was prepared by Emmanuelle B. Faubert, Economist at the MEI, with the collaboration of Renaud Brossard, Senior Director, Communications at the MEI.
Highlights
Economic theory assigns a crucial role to entrepreneurs, both in terms of innovation and productivity increases and in terms of economic coordination. However, for entrepreneurs to play their role optimally, they have to be remunerated by sufficient profits to compensate them for their risk-taking and their effort. By reducing profits, taxes obstruct entrepreneurship. This Paper evaluates the effect of personal income tax rate increases on entrepreneurship in Canada between 2016 and 2020. It also puts the financial impact of these rate hikes in perspective, notably in light of two electric vehicle battery subsidies announced in 2023 (for Volkswagen and Stellantis).
Chapter 1 – Impact of Marginal Tax Rate Hikes on Entrepreneurship from 2016 to 2020
- The relation between taxation and entrepreneurship is simple: the more an activity is taxed—and entrepreneurship is no exception—the less incentive there is to pursue it, all else being equal.
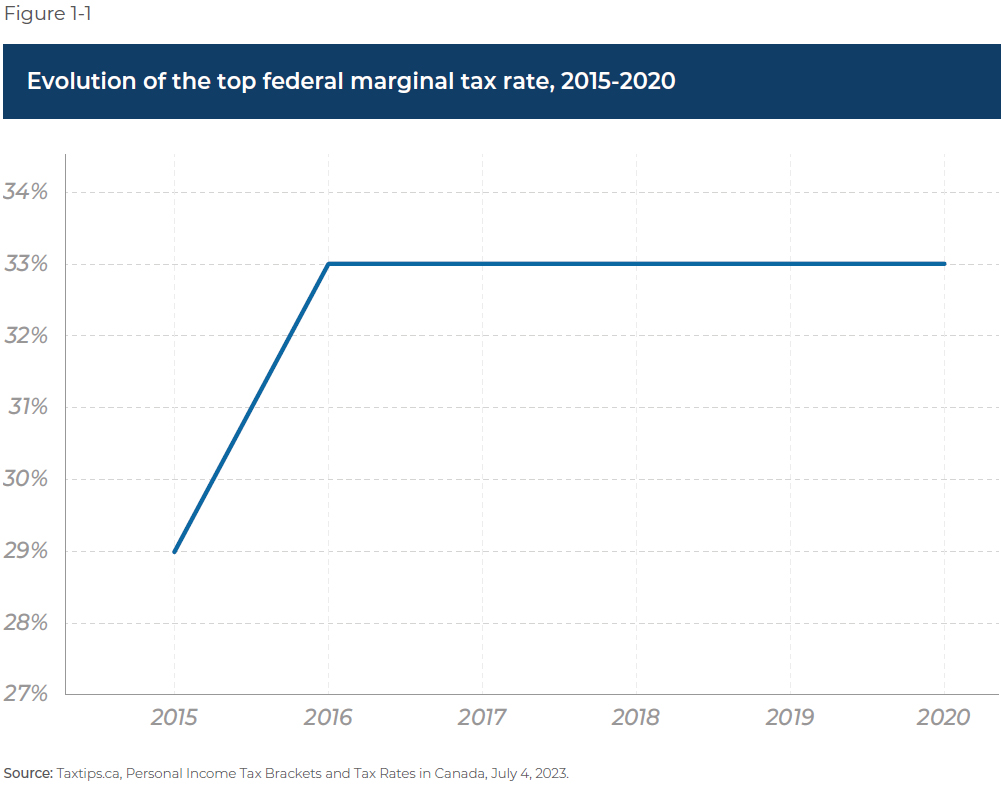
- In 2015, the top federal marginal income tax rate was 29%. In 2016, it was raised to 33% (through the creation of a new tax bracket), an increase of 4 percentage points.
- Several provinces also modified their marginal personal income tax rates in turn, and except for New Brunswick, combined federal and provincial rates were higher in 2020 than in 2016.
- We estimate the loss of new businesses across Canada due to the various increases in maximum marginal tax rates between 2015 and 2020 to be 12,195.
- We also estimate that the rate increases seen over this period entailed a reduction of approximately 15,518 self-employed people.
- One reason for these effects is the impact of tax increases on capital accumulation, an essential element for starting one’s own business. Increasing income taxes on potential entrepreneurs reduces the funds available for creating and maintaining a business.
- Moreover, income tax rate increases make the tax system less competitive and encourage investors to invest elsewhere, which ends up reducing opportunities for growth in the Canadian economy.
Chapter 2 – Comparing the Revenues from the Federal Income Tax Hike to Two Enormous Subsidies
- While taxpayers in the top tax bracket represent just 1.3% of all taxpayers in Canada, they account for 26% of net personal income taxes collected by the federal government in 2020.
- Following the four-point increase of the top federal income tax rate in 2016, the Office of the Parliamentary Budget Officer’s budget simulator estimates, relatively optimistically, that $2.88 billion of revenues in 2023 were attributable to the increase, a non-negligible impact for taxpayers.
- On the other hand, the revenues generated by this increase are just a drop in the bucket for the federal government’s budget, with total federal budget revenues for the year 2023-2024 amounting to $456.8 billion.
- In order to put these additional revenues into perspective, they are roughly equivalent to the $2.82 billion that will be swallowed up annually by two enormous subsidies recently announced by the federal and Ontario governments for the construction of two electric vehicle battery plants in Ontario.
- By subsidizing a few big companies in certain industries at the price of higher taxes, the government centralizes the country’s economy and prevents the market from acting in an optimal manner to encourage the growth and innovation that stem from entrepreneurship.
Introduction
The majority of Canadians think their tax burden is too high. A 2023 poll found that 67% believe they pay too much income tax. Moreover, 55% think the federal government spends too much.(1) In this context, the government pursues contradictory policies, on the one hand penalizing entrepreneurship with tax increases, and on the other hand trying to help companies with subsidies for the same amount as the additional revenue resulting from those increases.
Economic theory assigns a crucial role to entrepreneurs, both in terms of innovation and productivity increases (growth) and in terms of economic coordination (addressing shortages).(2) However, for entrepreneurs to play their role optimally, they have to be remunerated by sufficient profits to compensate them for their risk-taking and their effort. By reducing profits, taxes obstruct entrepreneurship.
Increases in the income tax rate—the tax that directly concerns entrepreneurs—have been empirically associated with reduced levels of entrepreneurship in the Canadian context. Notably, there is the empirical research of economist Ergete Ferede,(3) based on pan-Canadian data from 1984 to 2015. This Research Paper applies his analytical approach to the more recent period between 2015-2016 and 2020.
Which Indicators Measure Entrepreneurship?
In the literature on the topic, there is no perfect indicator that reflects entrepreneurial activities in all their complexity.(4) Several indicators have been proposed over the years, but two in particular recur regularly in the research:
- i) Business Entry Rate
The business entry rate is calculated by dividing the number of new businesses by the average number of active businesses.(5) This indicator reflects the importance of new business creation. If it slows, all other things being equal, it means that business creation is being hindered, and that the economy is less dynamic and is responding suboptimally to changing market conditions and consumer needs. - ii) Self-Employment Rate
The second indicator found in the literature corresponds to the self-employment rate in the economy, calculated by dividing the number of self-employed workers(6) by the total number of workers.(7) Beyond the administrative definition(8) (which can vary by country), self-employed workers have a profile that resembles that of true (micro)entrepreneurs, which is to say that they work for themselves, take risks, and earn profits or absorb losses personally.
While regularly used to measure entrepreneurship, this indicator is not the most appropriate one for measuring the impact of a change in the maximum marginal tax rate. Indeed, many self-employed workers are not concerned with changes to higher tax brackets because, for whatever reason, they do not generate sufficient revenues to find themselves in those brackets. It is for this reason that the analysis of self-employed persons is complementary to the primary analysis, which is focused on the first indicator, namely the business entry rate.
The purpose of this Paper is twofold.
– First, it aims to evaluate the effect of recent personal income tax rate increases on entrepreneurship. The first chapter empirically estimates the impact of modifications to maximum marginal tax rates in Canada between 2016 and 2020 on the two indicators of entrepreneurship mentioned above. (The available data unfortunately do not allow us to estimate the impact beyond 2020.) The calculations show that if the highest tax brackets had remained at their 2015 levels across Canada, nearly 12,200 new businesses could have been created during this period, and around 15,500 micro-entrepreneurs would have set off on their own.
– Second, the financial impact of these marginal tax rate hikes must be put in perspective, especially the largest of them, namely the Trudeau government’s four-percentage-point increase of the top federal rate in 2016, from 29% to 33%. It is useful for purposes of stimulating public debate to compare the additional revenues collected thanks to this increase with the enormous federal subsidies that this same government recently granted to help certain companies, for example those given to Volkswagen and Stellantis.
This Paper aims to determine whether it might be preferable to abstain from spending public funds to help a few businesses that enjoy political favours, and instead reduce the tax burden for all businesses, which would stimulate entrepreneurial creativity in the service of wealth creation and higher living standards.
Chapter 1 – Impact of Marginal Tax Rate Hikes on Entrepreneurship from 2016 to 2020
Although the negative impact of taxation on entrepreneurship is well understood on a theoretical level, it is important to look at what this means in reality, a more difficult task given the lack of a perfect indicator of entrepreneurship and of the multitude of factors that can affect it. It is therefore essential to examine this problem by studying empirically what changed in terms of taxation in Canada in recent years with regard to marginal personal income tax rates, and then to analyze the potential repercussions of decisions made on the two indicators of entrepreneurship presented in the Introduction.
1.1 Empirical Estimate of the Impact of an Increase in the Top Personal Tax Rates on Entrepreneurship
In theory, the relation between taxation and entrepreneurship is simple: the more an activity is taxed—and entrepreneurship is no exception—the less incentive there is to pursue it, all else being equal. However, for a multitude of reasons, it is difficult to know the precise impact of taxation on entrepreneurship. For example, what portion of the evolution of entrepreneurship in Canada is attributable to the increases in maximum personal tax rates seen between 2016 and 2020?
In this regard, the empirical work of economist Ergete Ferede is particularly useful. Based on pan-Canadian data from 1984 to 2015, the economist estimated the relation between an increase in the top marginal personal income tax rates and entrepreneurship in Canada in terms of: 1) the creation of new businesses and 2) the establishment of self-employed workers (micro-entrepreneurs)(9):
- He found that an increase of 1 percentage point in the maximum marginal tax rate reduced the business entry rate by 0.21 percentage points in the long term. It is easier, however, to represent the impact if we observe the number of businesses concerned, which is to say the potential number of additional businesses that would have been created if the tax rate had not gone up. If, for example, the total number of existing businesses over the years averages 20,000 (close to the number in New Brunswick or Newfoundland and Labrador), an increase in the marginal tax rate of 1 percentage point would result in a “loss” of 42 new businesses not created (20,000 x 0.21/100), whereas in a province with 200,000 businesses (close to the number in Quebec), the impact would be 420 new businesses not created.(10)
- The author also concluded that an increase of 1 percentage point in the marginal tax rate reduced the self-employment rate by 0.123 percentage points in the long term. In other words, if the marginal rate increases by 1 percentage point and there are 500,000 self-employed workers (close to the number in Quebec) this would reduce the number of people setting off on their own by 615. Such an increase would lead 1,230 micro-entrepreneurs to change their minds if there were 1,000,000 self-employed people (close to the number in Ontario).(11)
By using the results obtained by Ferede, it is possible to estimate the potential impact of top marginal tax rate increases between 2016 and 2020, both in terms of new businesses not created and in terms of reduced numbers of self-employed workers in Canada.(12)
1.2 Federal and Provincial Income Tax Increases between 2016 and 2020
Over the years, the federal and provincial governments have regularly modified their top income tax rates, gradually resulting in an overall increase in taxation. It is important to note that this is just one of the ways of modifying the tax burden, and other modifications to the tax system have not been taken into account in this analysis.
In 2015, the top federal marginal tax rate was 29%. In 2016, it was raised to 33%,(13) an increase of 4 percentage points (see Figure 1-1).
Several provinces in turn modified their marginal personal income tax rates, and except for New Brunswick, combined federal and provincial rates were higher in 2020 than in 2016.
Table 1-1 provides an overview of the cumulative changes (in percentage points) to the maximum combined federal-provincial marginal tax rates between 2016 and 2020, with 2015 as the base year.
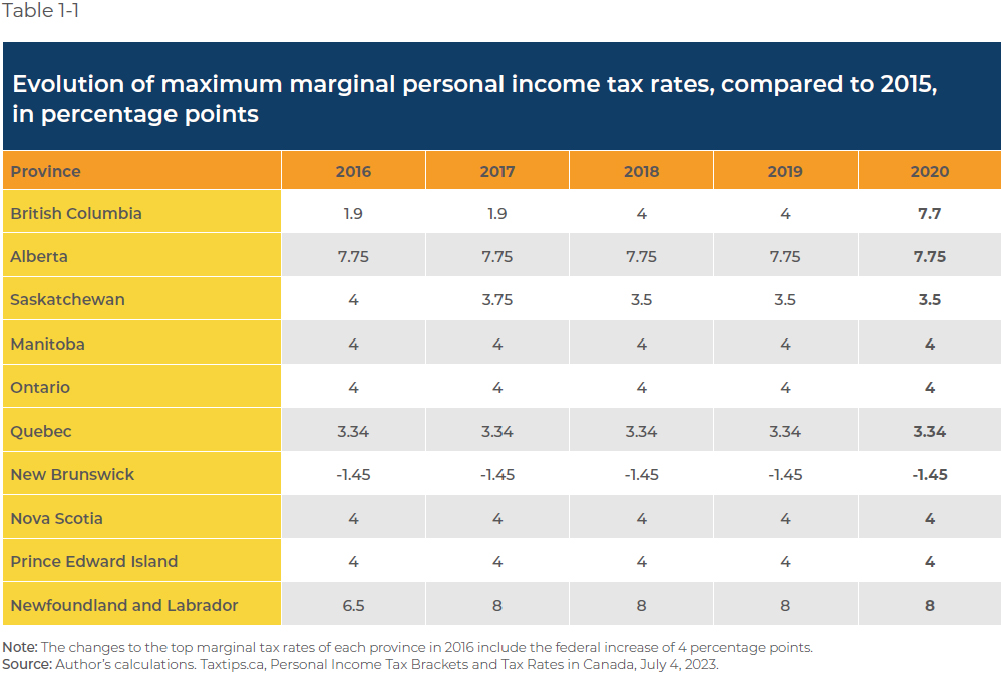
Taking into account changes that took place in Ottawa and in the provinces, the results are as follows:
British Columbia: Elimination of a tax bracket in 2016, bringing the top provincial rate down from 16.8% to 14.7%;(14) addition of a new bracket for incomes over $150,000 in 2018, increasing it from 14.7% to 16.8%;(15) addition of a new bracket for incomes over $220,000 in 2020, further increasing it from 16.8% to 20.5%.(16) Combined federal-provincial increase of 7.7 percentage points.
Alberta: Increase from 11.25% to 15% in 2016.(17) Combined increase of 7.75 percentage points, similar to British Columbia’s.
Saskatchewan: Reductions from 15% to 14.75% in 2017(18) and from 14.75% to 14.5% in 2018,(19) partially compensating the federal increase. Nonetheless, the combined federal-provincial rate was 3.5 percentage points higher in 2020 than in 2015.
New Brunswick: Elimination of a tax bracket in 2016, 25.75% to 20.3%.(20) This is the only province that not only lowered its maximum rate, but lowered it sufficiently to compensate for the 2016 federal hike. It is therefore the only province with a lower marginal tax rate in 2020 than in 2016 (-1.45 percentage points).
Newfoundland and Labrador: Increase from 14.3% to 16.8% in 2016 and from 16.8% to 18.3% in 2017.(21) This is the province with the greatest increase in its marginal tax rate (8 percentage points).
Manitoba, Ontario, Quebec,(22) Nova Scotia, and Prince Edward Island: No change in these provinces, the combined marginal rate increase being 4 percentage points.
1.3 Impact on Business Creation
In order to measure the impact of the increases in marginal tax rates on business creation, we carry out the following calculations.
First, we multiply the total rate variations (from Table 1-1) by 0.21, which gives us the percentage impact of these tax hikes on the business entry rate, as shown in the second column of Table 1-2. We then multiply this result by the average number of active businesses during the period under study (shown in the first column), which gives us the impact of these changes on the number of businesses created, presented in the last column.
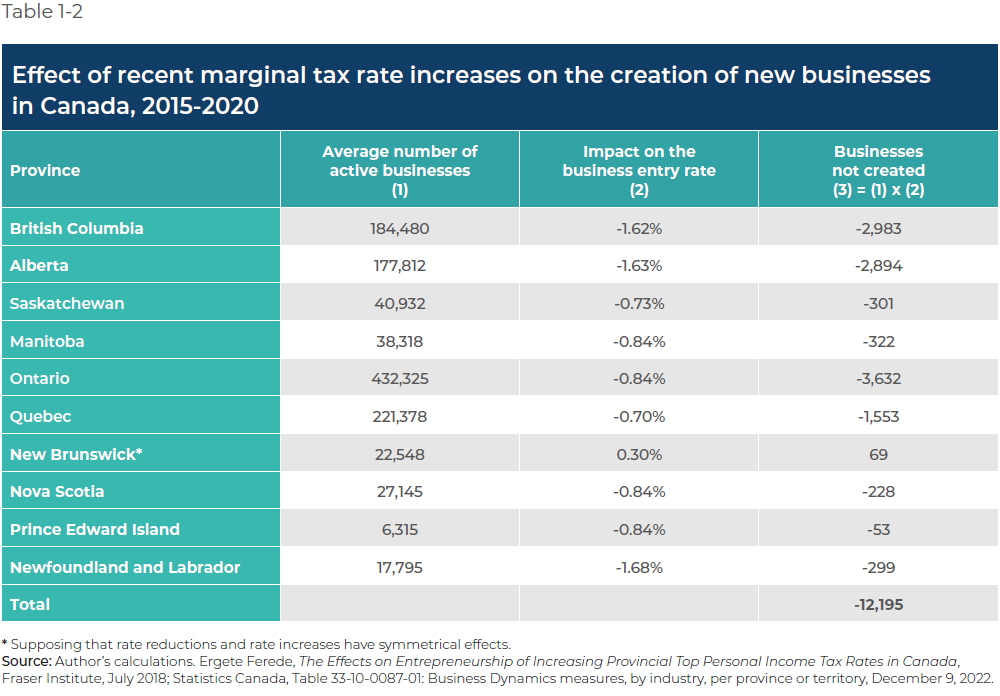
We estimate the loss of new businesses across Canada due to the various increases in maximum marginal tax rates between 2015 and 2020 to be 12,195. In other words, if the federal and provincial governments had maintained their tax rates at their 2015 levels, over 12,000 new businesses could have been created in 5 years.(23)
This is a substantial loss considering the impact of entrepreneurship on growth. Of course, this does not mean we would have that many more businesses today. After all, this calculation concerns new business creation, without taking into account what happens next, notably whether or not they survive. After five years, a significant portion of these new businesses could have closed down. The important thing, though, is that this is a process of trial and error, in which entrepreneurs create projects and test their ideas for doing something better or cheaper than what is already on offer on the market; when they are unable to do so, they go out of business. It is this process that the increase in the tax burden obstructs and threatens to make less efficient.
1.4 Impact on Self-Employment
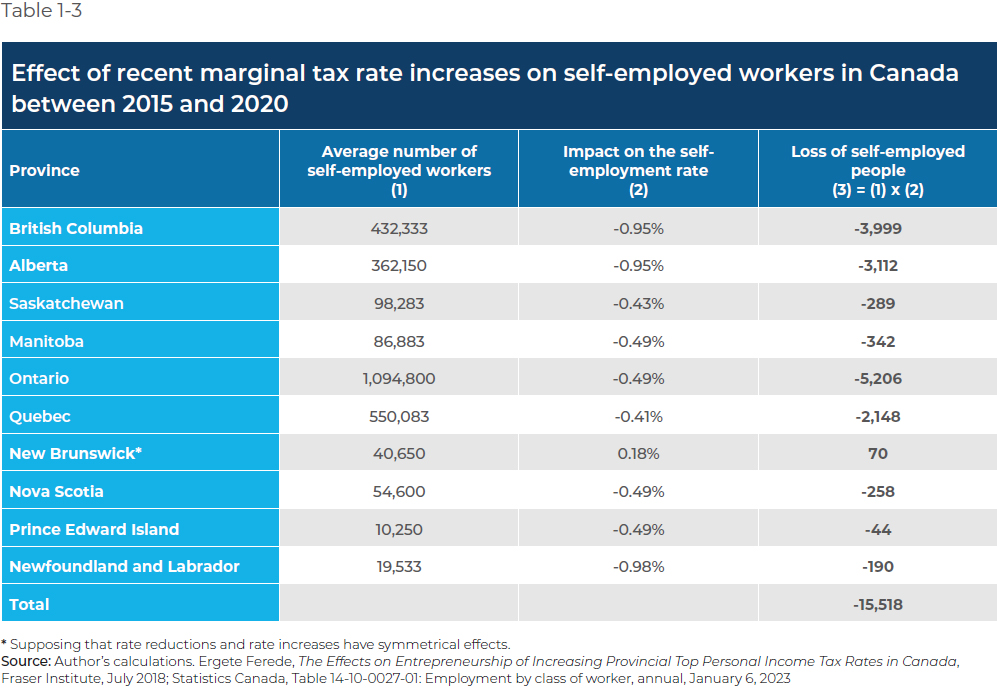
It is possible to carry out a similar calculation in order to analyze the impact of these changes from 2016 to 2020 on the number of self-employed workers. Table 1-3 shows us that the rate increases seen over this period entailed a reduction of approximately 15,518 self-employed people. As in the case of business creation, these results only concern the initial decision of workers to set off on their own, without indicating whether or not this number would be maintained in the longer term.
In this category are found a wide range of self-employed workers like artists, consultants, lawyers, musicians, and other kinds of entrepreneurs whose services, often of high added value, are well-suited to independent activity.(24) These micro-entrepreneurs are particularly sensitive to financial fragility and to the accessibility of the resources they need to carry out their work.(25) To better understand how marginal tax rate increases can affect self-employed people, we need only consider the example of digital entrepreneurs, which is to say those who only sell online products or services, without having to invest in physical spaces. This kind of entrepreneur is particularly likely to be affected by an increase in the tax burden.
One of the reasons often used to explain this effect is the impact of the tax increase on capital accumulation, an essential element for starting one’s own business. Increasing income taxes on potential entrepreneurs reduces the funds available for creating and maintaining a business.(26) Moreover, income tax rate increases make the tax system less competitive and encourage investors to invest elsewhere, which ends up reducing opportunities for growth in the Canadian economy.(27)
It is therefore crucial to put into perspective and explore in greater detail the impact of such tax increases on taxpayers’ wallets, as we shall do in the following chapter.
Chapter 2 – Comparing the Revenues from the Federal Income Tax Hike to Two Enormous Subsidies
The government’s main goal in raising personal income taxes is to increase its revenues. In order to put the relevant amounts in perspective, this chapter looks at the financial impact of the 2016 increase of the top federal income tax rate by four percentage points and compares the resulting revenues from this heavier tax burden to two enormous electric vehicle battery plant subsidies announced in 2023.
2.1 The Financial Impact
Table 2-1 shows the number of taxpayers in the top income tax bracket for the 2020 tax year.(28) While taxpayers in the top tax bracket represent just 1.3% of all taxpayers in Canada, they account for 26% of net personal income taxes collected by the federal government that same year.(29)

However, the additional revenues collected by the federal government are relatively small. According to the budget simulator of the Office of the Parliamentary Budget Officer (PBO), federal revenues are currently $2.88 billion higher than they would have been without the 4-percentage-point increase in the top rate.(30) It must be noted that this is an optimistic estimate; several studies carried out in the years following this hike calculated smaller revenue increases than the PBO’s estimate.(31) The additional revenues used in our analysis therefore represents the most optimistic scenario for the federal government in its quest to increase its tax revenues, the real figures being undoubtedly lower.
How does this additional tax burden compare to the enormous subsidies to two companies recently announced by the federal government?
2.2 A Heavier Tax Burden vs. Subsidies
The preceding section shows that the 2016 income tax rate hike had a non-negligeable impact on Canadian taxpayers. On the other hand, the revenues generated by this increase are just a drop in the bucket for the federal government’s budget. If we look at total federal revenues for the current year (2023-2024), Ottawa expects to take in $456.8 billion. In other words, the $2.88 billion collected due to the new bracket added in 2016 represents just 0.63% of the federal budget.(32)
In terms of economic activity and entrepreneurship, if the federal government had not raised its top income tax rate in 2016, it would have allowed the creation of 9,820 more new businesses and the entry onto the market of 12,724 more self-employed workers,(33) not to mention the other potential jobs created by the launch of these new businesses.
However, these additional revenues are roughly equivalent to the amount swallowed up by two enormous production subsidies recently announced by the federal and Ontario governments for the construction of two electric vehicle battery plants in Ontario.
Volkswagen
Volkswagen reached an agreement with the federal government in the spring of 2023 for the construction of a plant in St. Thomas, Ontario. The German automaker will get a total subsidy estimated at more than $16 billion over 10 years.(34) Of this amount, $13.2 billion will be a production subsidy, two-thirds of which will be paid by the federal government and the other third by the Ontario government.(35)
Stellantis
A second, similar agreement was reached in July 2023 between the federal and Ontario governments and Stellantis, a multinational French-Italian-American automotive group, for the construction of a second electric vehicle battery plant, this one in Windsor. It will benefit from a $15-billion production subsidy, a third of which is to be covered by the provincial government.(36)
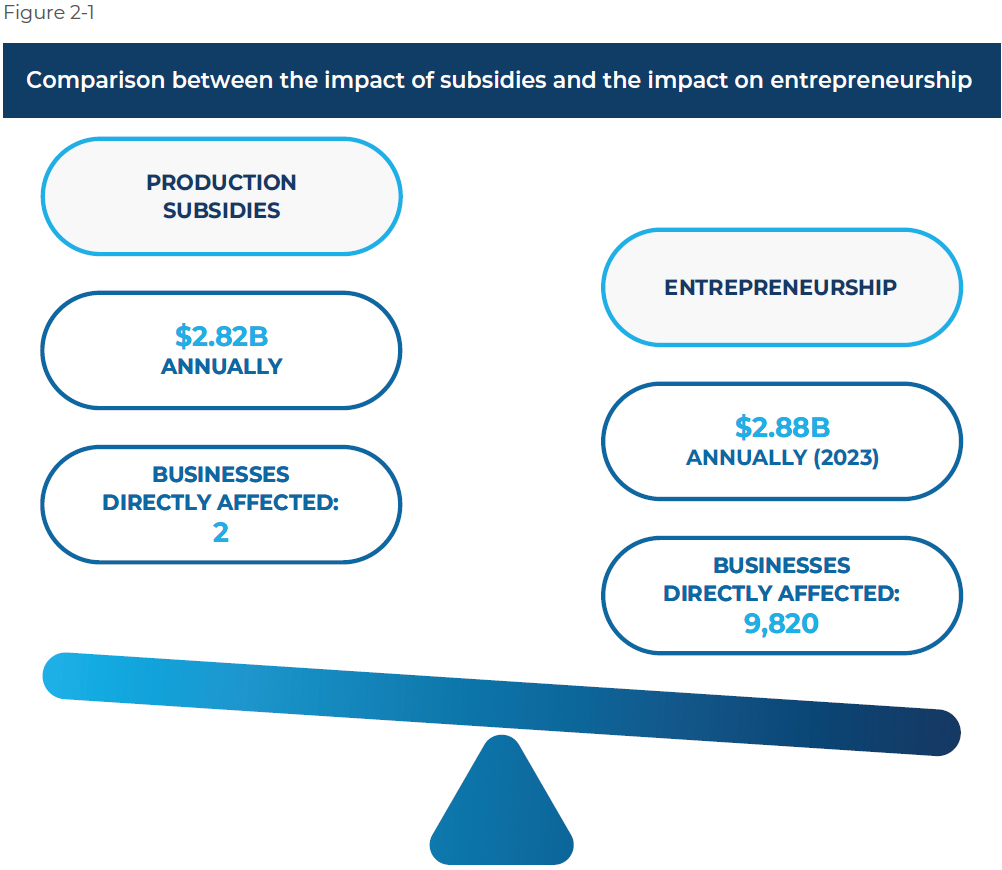
The combined production subsidies for Volkswagen and Stellantis ($13.2 billion and $15 billion respectively) total $28.2 billion, or $2.82 billion a year. This sum corresponds roughly to the $2.88 billion of additional revenues generated in 2023 by the 2016 increase in the top marginal federal income tax rate (see Figure 2-1). Comparatively speaking, according to the (optimistic) estimates based on the PBO numbers, the additional federal revenues generated by this 2016 increase are equivalent to the total Canadian subsidies for two battery plants.
We must not forget that with unemployment rates currently quite low and a significant labour shortage, there is no guarantee that the new positions created in the new battery plants will be filled. We therefore run the risk of having taken billions of dollars out of taxpayers’ pockets, and having negatively impacted entrepreneurship, just to displace jobs from one sector (or one company) to another.
It is also possible that the economic models of the subsidized companies will prove to be unsustainable, and as a result, that the billions of dollars paid by Canadian taxpayers will be wasted.
This situation contrasts two models of economic development that correspond to diametrically opposed policies.
On one side, the federal government can let entrepreneurs create, develop, or scale up industries based on supply and demand and Canada’s comparative advantages. On the other, it can stifle entrepreneurship by increasing the tax burden more and more and spend the revenues collected according to an interventionist logic with obvious political benefits but of dubious economic efficiency.
By subsidizing a few big companies in certain industries at the price of higher taxes, the government centralizes the country’s economy and prevents the market from acting in an optimal manner to encourage the growth and innovation that stem from entrepreneurship.
Conclusion
The relation between taxation and entrepreneurship has been studied before, but the analysis generally remains quite vague in terms of the real, concrete impact of income taxes on business creation and the number of self-employed workers. In this Paper, we sought to evaluate the concrete effect of increases in the top personal income tax rate in Canada between 2016 and 2020 on economic growth and dynamism.
By combining past empirical analyses with the latest data on entrepreneurship, we were able to estimate that these increases basically discouraged the creation of 12,000 new businesses and the entry onto the market of 15,000 self-employed workers.
How do we put in perspective the additional revenue collected following these tax increases, notably at the federal level?
While the increases in the top income tax rates are very costly for affected taxpayers, the amounts collected have a fairly insignificant impact on government finances. Indeed, the $2.88 billion that will be collected in 2023 according to the PBO’s budget simulator just from the 2016 increase in the top federal rate (an increase of four points, from 29% to 33%) is barely equivalent to the subsidies granted by the federal and Ontario governments in 2023 for the construction of two electric vehicle battery plants in Ontario. Had the federal government refrained from collecting this amount, 9,820 new companies could have been created and 13,500 people could have gone into business for themselves.
This leads us to examine the choice that can be made between two models of economic development. The first allows entrepreneurs, and therefore the market, to innovate, while the second happens in a centralized, arbitrary manner.
Centralized models have often been tried in the past, but their implementation has generally resulted in stagnating innovation, and therefore stagnating growth.
It would be wiser to let the dynamism of the market direct the country’s economic growth, through the actions of the numerous businesses that come and go, but that never stop innovating and investing. To do so, we need a competitive environment that is favourable to entrepreneurship and investment, and instead of increasing top personal income tax rates, we need to reduce them.
References
- Ipsos, “Tax in Canada 2023,” poll commissioned by the MEI, July 20, 2023.
- David B. Audretsch, Max C. Keilbach, and Erik E. Lehmann, Entrepreneurship and Economic Growth, Oxford University Press, 2006, pp. 3-4.
- Ergete Ferede, The Effects on Entrepreneurship of Increasing Provincial Top Personal Income Tax Rates in Canada, Fraser Institute, July 2018.
- Ibid., p. 10.
- Statistics Canada, Table 33-10-0087-01: Business Dynamics measures, by industry, per province or territory, December 9, 2022.
- The number of self-employed workers excludes self-employed agricultural workers, as in Ergete Ferede (2018). Statistics Canada, Table 14-10-0027-01: Employment by class of worker, annual, January 6, 2023.
- According to Revenu Québec, you are a self-employed person if you are “free to choose the means of carrying out a contract and no relationship of subordination exists between you and your client.” Revenu Québec, Self-Employed Persons, Your Status, Criteria Used to Determine a Worker’s Status, consulted August 17, 2023.
- “Working owners of a business, farm, or professional practice that is not incorporated and self-employed persons who do not have a business (for example, baby-sitters, newspaper carriers). This group does not have employees.” Statistics Canada, Definitions, data sources and methods, Statistical classifications, Classification of worker – Employment type, 8.2.4 – Self-employed unincorporated, no paid help, May 2, 2019.
- Ergete Ferede, The Effects on Entrepreneurship of Increasing Provincial Top Personal Income Tax Rates in Canada, Fraser Institute, July 2018.
- Author’s calculations based on the average number of active businesses between 2015 and 2020.
- Author’s calculations based on employment data from 2015 to 2020.
- The calculations end in 2020, as this is the most recent year for which data on the business entry rate are available.
- This was actually the addition of a new top tax bracket. This change therefore applies only to taxpayers with incomes over $200,000. Taxtips.ca, Canada – Federal 2015 and 2016 Tax Brackets and Marginal Tax Rates, July 4, 2023.
- Taxtips.ca, BC 2015 and 2016 Personal Marginal Income Tax Rates, July 4, 2023.
- Taxtips.ca, BC 2017 and 2018 Personal Marginal Income Tax Rates, July 4, 2023.
- Taxtips.ca, BC 2019 and 2020 Personal Marginal Income Tax Rates, July 4, 2023.
- Taxtips.ca, Alberta 2015 and 2016 Personal Marginal Income Tax Rates, July 4, 2023.
- Taxtips.ca, Saskatchewan 2016 and 2017 Personal Marginal Income Tax Rates, July 4, 2023.
- Taxtips.ca, Saskatchewan 2017 and 2018 Personal Marginal Income Tax Rates, July 4, 2023.
- Taxtips.ca, New Brunswick 2015 and 2016 Personal Marginal Income Tax Rates, July 4, 2023.
- Taxtips.ca, Newfoundland & Labrador 2015 and 2016 Personal Marginal Income Tax Rates, July 4, 2023; Taxtips.ca, Newfoundland & Labrador 2016 and 2017 Personal Marginal Income Tax Rates, July 4, 2023.
- Note that the marginal tax rate increase in Quebec is not equal to the increase of 4 percentage points in the federal rate because of the Quebec Abatement. Government of Canada, Department of Finance Canada, Federal transfers to provinces and territories, Quebec Abatement, October 24, 2016.
- These calculations are based on the average number of businesses during the five years under study.
- Adobe, What is a micro-entrepreneur? Examples of micro-entrepreneurship, consulted August 10, 2023.
- Vrajlal K. Sapovadia, “Micro Finance: The Pillars of a Tool to Socio-Economic Development,” Development Gateway, 2006.
- Valentin Petkantchin and Nathalie Elgrably-Lévy, Choking Hazard: The Adverse Effects of “Eat the Rich” Policies, MEI, Research Paper, September 2022, p. 17.
- Ibid., p. 25.
- Canada Revenue Agency, Income Statistics and GST/HST Statistics, Table 1: Individual tax filers by province or territory and tax bracket (2020 tax year), March 27, 2023.
- Canada Revenue Agency, Income Statistics and GST/HST Statistics, Table 3: Net federal tax by province or territory and tax bracket (2020 tax year), March 27, 2023.
- Impact per 0.25% change: $180M. ($0.18B x 16 = $2.88B). Office of the Parliamentary Budget Officer, Tools, Ready Reckoner, consulted September 12, 2023.
- Michael Smart and James Uguccioni, “Estimating taxpayer responses to top tax reforms,” Proceedings of the Annual Conference on Taxation and Minutes of the Annual Meeting of the National Tax Association, Vol. 112, June 8, 2019; Ben Eisen, Milagros Palacios, and Nathaniel Li, No Free Lunch for the 99 Percent: Estimating Revenue Effects from Taxes on Top Earners, Fraser Institute, April 2022; Ergete Ferede, The Revenue Effects Of Tax Rate Increases On High-Income Earners, Fraser Institute, 2019; Alexandre Laurin, “Unhappy Returns: A Preliminary Estimate of Taxpayers Responsiveness to the 2016 Top Tax Rate Hike,” CD Howe Institute, September 27, 2018.
- Government of Canada, Budget 2023: A Made-in-Canada Plan, March 28, 2023, p. 206.
- Calculation carried out using the same method described in Chapter 1 but taking into account only the federal marginal tax rate increase of four percentage points and ignoring the changes to provincial taxation.
- Richard Raycraft, “Volkswagen battery plant to cost Ottawa over $16B: budget watchdog,” CBC News, June 14, 2023.
- Jill Giswold, Break-even Analysis of Production Subsidies for Stellantis-LGES and Volkswagen, Office of the Parliamentary Budget Officer, September 12, 2023, p. 2.
- Adam Radwanski and Laura Stone, “With Stellantis, Volkswagen deals, Ontario eyes bigger role in battery plant subsidies,” The Globe and Mail, July 6, 2023.