Activity-Based Hospital Funding in Alberta: Insights from Quebec and Australia

Economic Note examining the benefits of paying hospitals per service delivered, whereby patients are viewed as a source of revenue, not merely as a cost
 Related Content
 |
 |
 |
| Think tank says Alberta should import Quebec model of activity-based funding for hospitals (Western Standard, April 28, 2024)
Alberta urged to adopt new health care funding model to cut hospital costs and wait times (Red Deer Advocate, April 29, 2024) |
This Economic Note was prepared by Krystle Wittevrongel, Senior Policy Analyst and Alberta Project Lead at the MEI. The MEI’s Health Policy Series aims to examine the extent to which freedom of choice and entrepreneurship lead to improvements in the quality and efficiency of health care services for all patients.
Alberta’s healthcare system costs more than those of many of its peers across Canada and internationally, yet underperforms by many metrics—wait times perhaps being the most visible.(1) For instance, while Alberta consistently spends a fair deal more per capita on health care than Canada’s other large provinces do, the median wait time from referral by a GP to treatment by a specialist was 33.3 weeks in 2022, versus 29.4 weeks in Quebec, 25.8 weeks in British Columbia, and 20.3 weeks in Ontario. Albertans waited a median 232 days for a hip replacement that year, longer than those in Quebec, British Columbia, and Ontario.(2) In Australia, meanwhile, the median wait time for a total hip replacement in 2022 was 175 days in public hospitals.(3)
One of the things keeping Alberta’s healthcare system from better performance is that it relies on global budgets for its hospital financing. Such a system allocates a pre-set amount of funding to pay for an expected number of services, based largely on historical volume. The problem with global budgets is that they disregard the actual costs incurred to deliver care, while undermining incentives to improve outcomes. This ultimately leads to rationing of care, with patients viewed as a cost that must be managed.
Activity-based funding systems are associated with reduced hospital costs, increased efficiency, and shorter wait times, among other things.
An alternative is activity-based funding (ABF), which has largely replaced global budgeting in many OECD countries, and is starting to do so in some Canadian provinces.(4) With ABF, hospitals receive a fixed payment for each specific service delivered, adjusted for certain parameters.(5) If a hospital treats more patients and delivers more services, it receives more funding; if it does less, it receives less. In essence, the money follows the patient, which has a dramatic effect: patients are now viewed as a source of revenue, not merely as a cost. Studies have shown that ABF systems that include appropriate safeguards for quality and waste are associated with reduced hospital costs, increased efficiency, and shorter wait times, among other things.(6)
To increase its capacity and performance, Alberta should consider moving to such a system for hospital financing. As over 25% of total health spending in the province goes to hospitals,(7) driving down costs and finding efficiencies is of paramount importance.
ABF models vary by jurisdiction and context to account for distinct situations and the particular policy objectives being pursued.(8) Two jurisdictions provide interesting insights: Quebec, with ABF hospital funding being gradually implemented in recent years, and Australia, where after more than three decades, ABF is the rule, global budgets the exception.
ABF in Quebec: Increased Performance and Decreased Costs
Quebec’s hospital payment reforms over the past two decades have been aimed at better linking funding with health care delivery to improve care quality and access.(9) These patient-based funding reforms (a type of ABF) have resulted in increased volumes and efficiency, and reduced costs and wait times for a number of surgical and other procedures in Quebec.(10)
These reforms started in 2004, when Quebec applied ABF in the context of additional funding to select surgeries in order to reduce wait times through the Access to Surgery Program.(11) The surgeries initially targeted were hip replacement, knee replacement, and cataract surgeries, but other procedures were eventually integrated into the program as well. Its funding covered the volume of surgeries that exceeded those performed in 2002-2003, and it used the average cost for each specific surgery. Procedures were classified by cost category, which also took into account the intensity of resource use and unit cost based on direct and indirect costs.
The expansion of ABF in Quebec aims to relieve hospital congestion by driving down wait times and shrinking wait lists.
By 2012-2013, this targeted program had helped to significantly increase the volume of surgeries performed, as well as decrease wait times and length of stay.(12) However, as ABF was applied only to surplus volumes of additional surgeries, efficiency gains were limited. For this reason, among others, the Expert Panel for Patient-Based Funding recommended expanding the program,(13) and in 2012, the Government of Quebec began considering further pilot projects for gradual ABF implementation.(14)
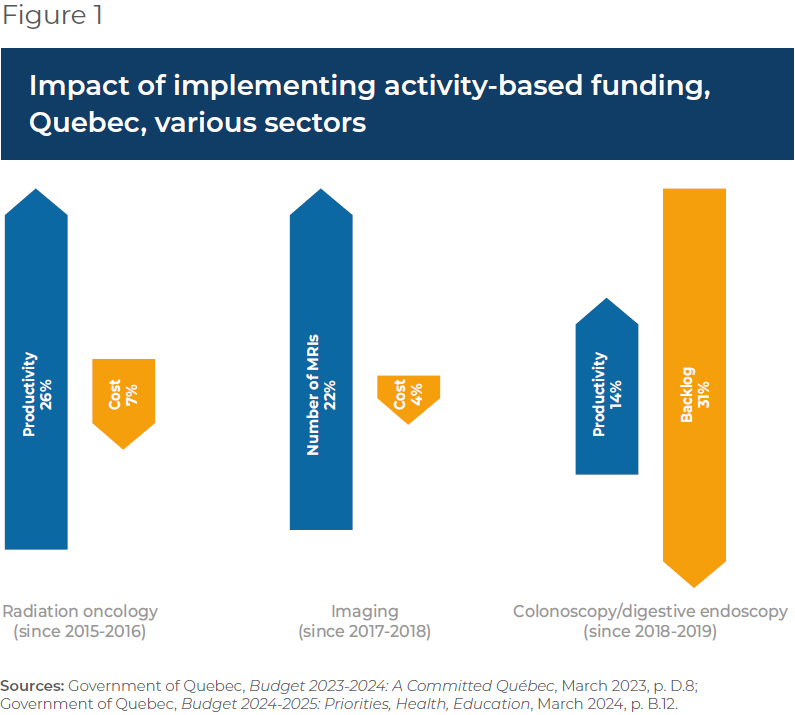
- In 2015, ABF was implemented in the radiation oncology sector, which resulted in better access to services at a lower cost, with productivity having increased more than 26% by 2023-2024, and average procedure costs having fallen 7%.(15)
- In 2017-2018, ABF was implemented in imaging, which resulted in the number of magnetic resonance imaging tests increasing more than 22% while driving the unit cost of procedures down 4%.(16)
- Following the above successes, in 2018-2019, the colonoscopy and digestive endoscopy sector also moved to ABF, which led to a productivity increase of 14% and a 31% decrease in the case backlog.(17)
Overall, then, Quebec has experienced increased productivity and efficiency, as well as reduced costs, in those sectors to which ABF has been applied (see Figure 1).
The Department of Health and Social Services continued to expand ABF to more surgeries in 2023, following which it was expected that about 25% of the care and services offered in physical health in Quebec hospitals would be funded in this manner, with the goal of reaching 100% by 2027-2028.(18) Further, the 2024-2025 budget expanded ABF again to include the medicine, emergency, neonatal, and dialysis sectors.
This expansion of ABF aims to relieve hospital congestion by driving down wait times and shrinking wait lists.(19) It will also align Quebec’s health care funding with what has become standard in most OECD countries. In Australia, for instance, ABF is the rule, not the exception, covering a large proportion of hospital services.
Australia’s Extensive Use of ABF
Australia also implemented ABF in stages, as Quebec is now doing. It was first introduced in the 1990s in one state and adopted nationally in 2012 for all admitted programs to increase efficiency, while also integrating quality and safety considerations.(20) These considerations act as safeguards to ensure efficiency incentives don’t negatively impact services. For instance, there are adjustments to the ABF payment framework in the presence of hospital acquired complications and avoidable hospital readmissions, two measures of hospital safety and service quality.(21) If service quality were to decrease, funding would be adjusted, and payments would be withheld. Not only has ABF been successful in increasing hospital efficiency in Australia, but it has also enabled proactive service improvement, which has in turn had a positive impact on safety and quality.(22)
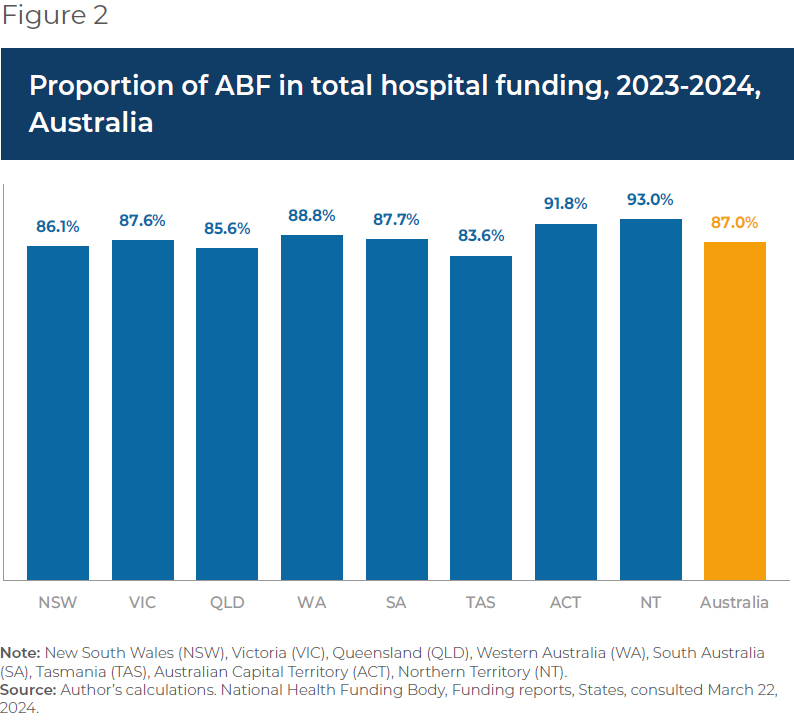
ABF now makes up 87.0% of total hospital spending in Australia, ranging from 83.6% in Tasmania to 93.0% in the Australian Capital Territory.
Currently, ER services, acute services, admitted mental health services, sub-acute and non-acute services, and non-admitted services are funded with ABF in Australia. This includes rehabilitation, palliative, geriatric and/or maintenance care.(23) Global budgets are still used for some block funding, but this is the exception, restricted to certain hospitals, programs, or specific episodes of care.(24) Small rural hospitals, non-admitted mental health programs, and a few other highly specialized therapies or clinics or some community health services tend to be block funded due to higher than average costs stemming from a lack of economies of scale and inadequate volumes, among other things.
When first introduced, ABF made up about 25% of hospital revenue (approximately where Quebec currently stands).(25) ABF now makes up 87.0% of total hospital spending in Australia, ranging from 83.6% in Tasmania to 93.0% in the Australian Capital Territory (see Figure 2).
There is more variability, however, at the local hospital network level within territories or states. For instance, between 2019 and 2024, an average of 92.3% of total funding for the hospitals in the South Eastern Sydney Local Health District was ABF, and just 7.7% was block funding.(26) For the hospitals in the Far West Local Health District, in comparison, ABF represented an average of 72.0% of total funding, and block payments 28.0%, over the same period.(27)
The proportion of ABF funding per hospital is dictated, for the most part, by the types and volumes of patient services provided, but also by hospital characteristics and regional patient demographics.(28) For example, there could be a need to compensate for differences in hospital size and location, or to reimburse for some alternative element of the fixed cost of providing services. In the Far West Local Health District, on average 65.1% of block funding between 2019-2020 and 2023-2024 was provided for small rural hospitals, while only 1.4% of the block funding in the South Eastern Sydney Local Health District was for these types of hospitals.(29) Ultimately, these two districts serve very different populations, with the Far West Local Health District being the most thinly populated district in Australia.(30)
Overall, ABF implementation in Australia has significantly improved hospital performance. Early after ABF implementation, the volume of care in Australia increased, and waiting lists decreased by 16% in the first year.(31) Between 2005 and 2017 the hospitals that were funded by ABF in Queensland became more efficient than those receiving block funding.(32) In addition, ABF can contribute to reductions in extended lengths of stay and hospital readmission,(33) both of which are expensive propositions for health care systems and also tie up hospital beds and resources.
Conclusion
ABF has been associated with reduced hospital costs, increased efficiency, and shorter wait times, areas where Alberta is lacking and reform is needed. To increase its health system performance, Alberta should consider emulating Quebec and moving to an activity-based funding system. Indeed, based on the experience of countries like Australia, widespread application should be the goal, as it is in Quebec. Alberta patients have already waited far too long for timely access to the quality care they deserve. The time to act is now.
References
- Public Health Emergencies Governance Review Panel, Appendices, November 2023, pp. 186-200.
- In 2022 Quebecers waited a median of 203 days, British Columbians 149 days, and Ontarians 108 days. Canadian Institute for Health Information, Explore wait times for priority procedures across Canada, consulted April 4, 2024.
- In 2022-2023, which was up from 153 days in 2021-2022. Australians also generally spend less on health care than Albertans. Australian Government, Australian Institute of Health and Welfare, Elective surgery, December 6, 2023; OECD, OECD Data Explorer, Waiting times, Australia, Hip replacement (total and partial, including the revision of hip replacement), consulted April 10, 2024.
- Karen S. Palmer et al., “Activity-Based Funding of Hospitals and Its Impact on Mortality, Readmission, Discharge Destination, Severity of Illness, and Volume of Care: A Systematic Review and Meta-Analysis,” PLoS One, Vol. 9, No. 10, 2014, p. 2.
- This was also recommended by the Public Health Emergencies Governance Review Panel in its Final Report, November 2023, pp. 89-90.
- George S. Chulis, “Assessing Medicare’s Prospective Payment System for Hospitals,” Medical Care Review, Vol. 48, No. 2, 1991, p. 200; Erik Biørn et al., “How different are hospitals’ responses to a financial reform? The impact on efficiency of activity-based financing,” Health Care Management Science, Vol. 13, 2010, pp. 9-10; Reinhard Busse et al., “Diagnosis-related groups in Europe: moving towards transparency, efficiency, and quality in hospitals?” BMJ, 2013, pp. 1-2; Siok Swan Tan et al., “DRGs and cost accounting: Which is driving which?” in Reinhard Busse et al., Diagnosis-related groups in Europe: moving towards transparency, efficiency and quality in hospitals, Buckingham, Open University Press and WHO Regional Office for Europe, 2011, p. 216.
- Toula Mazloum, “Alberta health spending to climb to $41.9 billion in 2023: CIHI report,” Edmonton Journal, November 2, 2023.
- Maude Laberge et al., “Hospital funding reforms in Canada: a narrative review of Ontario and Quebec strategies,” Health Research Policy and Systems, Vol. 20, No. 76, 2022, p. 2; Jordan Isenberg, “Moving Towards Activity-Based Financing: Interjurisdictional Experience and Outlook for Quebec,” McGill University, 2014, p. 1.
- With the Access to Surgery Program. Maude Laberge et al., ibid.; Expert Panel for Patient-Based Funding, Better Access to Surgery: An expanded activity-based funding program, Technical Paper 1, Government of Quebec, 2014, p. 9.
- Government of Quebec, Budget 2023-2024: A Committed Québec, March 2023, p. D.8.
- Expert Panel for Patient-Based Funding, op. cit., endnote 9.
- Over 2002-2003 values. With no impact on in-hospital mortality. Ibid, pp. 9-14; Maude Laberge and Myriam Champagne, “Rapport de colloque – Financement axé sur le patient : quelles considérations pour le Québec?” March 2019, p. 12.
- Ibid, p. 19.
- Government of Quebec, Budget 2012-2013 : Budget Speech, March 20, 2012, p. 7.
- This results in a recurring savings of $15 million for the network due to a 7% decrease in the average procedure cost in 2023-2024 compared to 2014-2015. Government of Quebec, op cit., endnote 10, p. D.8; Government of Quebec, Budget 2024-2025: Priorities, Health, Education, March 2024, p. B.12.
- Compared to 2015-2016 data. Idem.
- Idem.
- Government of Quebec, op cit., endnote 10.
- Government of Quebec, op cit., endnote 15.
- Liza Heslop, “Activity-based funding for safety and quality: A policy discussion of issues and directions for nursing-focused health services outcomes research,” International Journal of Nursing Practice, Vol. 25, No. 5, p. 2; Bao Hoang Nguyen et al., “Activity based funding reform and the performance of public hospitals: The Case of Queensland, Australia,” Working Paper, School of Economics, University of Queensland, November 2022, pp. 2, 4, and 26; Australian Healthcare and Hospitals Association, “Public Hospital Funding,” April 2020.
- Samuel B. G. Webster et al., “Incorporating Safety and Quality Measures Into Australia’s Activity-Based Funding of Public Hospital Services,” Hospital Services Insights, Vol. 16, 2023, pp. 1-2.
- J. Downie, “More than just activity: Pricing and funding for quality and safety,” HIM Association Australia, as cited in Liza Heslop, ibid.
- National Health Funding Body, Home, Public hospital funding, Funding types, consulted March 9, 2024.
- A specific threshold is used to determine whether a public hospital will receive any block funding, and all hospital activity is included in assessing the hospital against this low-volume threshold. Block funding is also in place for scenarios where the components of ABF are not currently available to enable activities to be priced, such as teaching and training activities (unless delivered in conjunction with patient care). Idem; Independent Health and Aged Care Pricing Authority, “Pricing Framework for Australian Public Hospital Services,” December 2023, pp. 15 and 26.
- Andrew Street et al., “Introducing activity-based financing: a review of experience in Australia, Denmark, Norway and Sweden,” Centre for Health Economics, York University, 2007, p. 7.
- Author’s calculations. Of eight public hospitals in addition to other community-based health care services. National Health Funding Body, Funding reports, Local hospital networks, South Eastern Sydney Local Health District, Jan 2024, consulted March 9, 2024.
- Author’s calculations. There are seven public hospitals in this district. National Health Funding Body, Funding reports, Local hospital networks, Far West Local Health District, Jan 2024, consulted March 9, 2024.
- Canadian Institute for Health Information, “The Why, the What and the How of Activity-Based Funding in Canada: A Resource for Health System Funders and Hospital Managers,” Health System Performance, 2013, p. 15; Andrew Street et al., op. cit., endnote 25, p. 4.
- Author’s calculations.
- Based on the 2016 Census. NSW Government, “South Eastern Sydney District Data Profile: Sydney, South Eastern Sydney, Northern Sydney,” 2023, pp. 8 -9; NSW Government, “Far West District Data Profile: Murrumbidgee, Far West and Western NSW,” 2023, pp. 8-9. NSW Government, NSW Health, Far West, consulted March 9, 2024; National Health Funding Body, Funding reports, Local hospital networks, Far West Local Health District Reports, consulted March 9, 2024.
- Karen S. Palmer, op cit., endnote 4, p. 9; Andrew Street et al., op. cit., endnote 25, pp. 38-39. Some studies show mixed results.
- Bao Hoang Nguyen et al., op cit., endnote 20, p. 26.
- PwC, Funding for value, 2018, p. 6.