Viewpoint – Supply Management Makes the Poor Even Poorer

As a result of a recent decision by the Canadian Dairy Commission, the price of industrial milk is set to increase on September 1st, 2016. Numerous studies have found that supply management, under which Canada’s dairy and poultry sectors operate, imposes a large cost per family through higher consumer prices than could be obtained on open markets. Furthermore, these higher prices place more of a burden on poorer households than on richer ones.
Media release: Supply management pushes up to 190,000 Canadians into poverty
 Links of interest
 |
 |
 |
|
Impoverished by Big Dairy (National Post, August 31, 2016)
La gestion de l'offre appauvrit trop de Canadiens (La Presse+, September 2, 2016) |
Interview (in French) with Vincent Geloso (Duhaime-Drainville le midi, FM93, August 31, 2016) |
Viewpoint – Supply Management Makes the Poor Even Poorer
As a result of a recent decision by the Canadian Dairy Commission, the price of industrial milk is set to increase on September 1st, 2016. Numerous studies have found that supply management, under which Canada’s dairy and poultry sectors operate, imposes a large cost per family through higher consumer prices than could be obtained on open markets. Furthermore, these higher prices place more of a burden on poorer households than on richer ones.
The Uneven Burden of Supply Management
The immediate objective of supply management policy is to restrict the supply of poultry, eggs, and dairy products. Production quotas that farmers must acquire are the main tool used to restrict production. In order to keep Canadians from importing less expensive goods from other countries, prohibitive import duties are imposed on these products.(1)
Estimates of the extra cost borne by the average Canadian household have generally been quite high: from $300 to $444 a year per household.(2) Proponents of supply management often argue that the policy supports the incomes of the 13,500 farm households in the dairy and poultry sectors.(3) The costs, however, are borne by 35 million Canadians.
This burden falls disproportionately on poorer households. A recent estimate found that after controlling for consumption patterns, the poorest 20% of Canadian households paid $339 more per year than they would have in the absence of supply management, representing 2.29% of their incomes. In comparison, the richest 20% of Canadians paid $554 more, but this only represented 0.47% of their incomes.(4) This has the concrete effect of essentially pushing many households into poverty.
How Many Canadians Are Pushed into Low-Income Status?
To estimate the number of Canadians pushed below the poverty line, we relied on the Survey of Labour and Income Dynamics produced by Statistics Canada.(5) The cost of supply management is estimated by comparing prices in neighbouring American states(6) with prices reported in Canada by Statistics Canada.(7) To capture the total cost of this policy, we constructed a basket of goods consumed by Canadians.(8)
The difference between the costs of Canadian and American baskets represents the cost of supply management. Our estimate of the burden of this policy is in line with that found by other researchers ($438 for the average Canadian household in 2011).
We then calculated the extent to which supply management effectively pushed Canadians below the poverty line. We used two different lines to provide a range of estimates. The low estimate is based on the Basic Necessities poverty line calculated by Christopher Sarlo of the University of Nipissing.(9) That poverty line is a measure of absolute poverty, designed to capture the deepest levels of material deprivation.
The other measure, provided by Statistics Canada, is a measure of relative poverty. The Low Income Cut-Offs (LICOs) are thresholds below which families spend 20 percentage points more of their incomes than the average family on food, shelter, and clothing.(10) Although it is not a measure of poverty in the sense of material deprivation, it is a measure of the precarious situation of households.
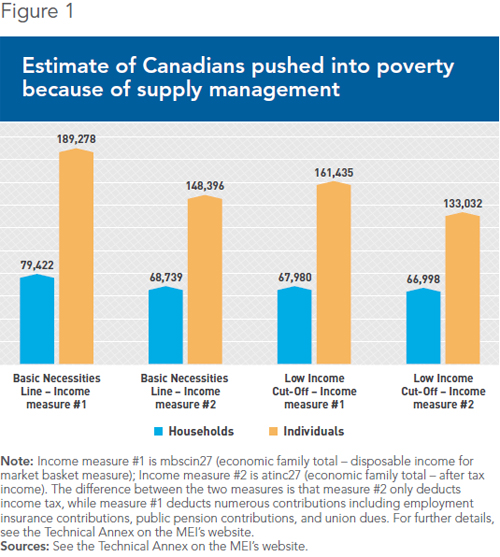
We also used two measures of disposable income, again to provide a range of estimates. In each case, we then calculated the number of households (and of individuals) that are below the poverty and low-income thresholds, but that would be above them if they had at their disposal the additional amounts they spent because of supply management.
The results, seen in Figure 1, show that the number of Canadians adversely affected by supply management is considerable. Using the Basic Necessities line, between 148,396 and 189,278 Canadians are pushed into poverty. Using the Low Income Cut-Off, between 133,032 and 161,435 Canadians are pushed into poverty.

Conclusion
Those who are preoccupied with the plight of the poor should reflect on the burden imposed upon them by supply management. A reform plan that would phase out production quotas and import duties would benefit all Canadian consumers, but it would especially benefit poorer individuals, raising their living standards and effectively lifting many of them out of poverty.
This Viewpoint was prepared by Vincent Geloso, Associate Researcher at the MEI, and Alexandre Moreau, Public Policy Analyst at the MEI. The MEI’s Regulation Series seeks to examine the often unintended consequences for individuals and businesses of various laws and rules, in contrast with their stated goals.
References
1. Giancarlo Moschini and Karl D. Meilke, “Tariffication with Supply Management: The Case of the U.S.-Canada Chicken Trade,” Canadian Journal of Agricultural Economics, Vol. 39, No. 1, March 1991, pp. 55-68; Bruce L. Benson and M. D. Faminow, “Regulatory Transfers in Canadian/American Agriculture: The Case of Supply Management,” Cato Journal, Vol. 6, No. 1, Spring/Summer 1986, pp. 271-294; Andrew Schmitz, “Supply Management in Canadian Agriculture: An Assessment of the Economic Effects,” Canadian Journal of Agricultural Economics, Vol. 31, No. 2, July 1983, pp. 135-152; Michele Veeman, “Social Costs of Supply-Restricting Marketing Boards,” Canadian Journal of Agricultural Economics, Vol. 30, No. 1, March 1982, pp. 21-36.
2. Marcel Boyer and Sylvain Charlebois, “Supply Management of Farm Products: A Costly System for Consumers,” Economic Note, MEI, August 2007, p. 3; Ryan Cardwell, Chad Lawley, and Di Xiang, “Milked and Feathered: The Regressive Welfare Effects of Canada’s Supply Management Regime,” Canadian Public Policy, Vol. 41, No. 1, March 2015, p. 8.
3. Mario Dumais and Youri Chassin, “Canada’s Harmful Supply Management Policies,” Viewpoint, MEI, June 2015, p. 1.
4. Ryan Cardwell, Chad Lawley, and Di Xiang, op. cit., endnote 2, pp. 9-10.
5. Statistics Canada, Survey of Labour and Income Dynamics (SLID) – 2011, Cross-sectional Public-use Microdata Files, June 2013; Statistics Canada, User’s Guide for Cross-Sectional Public-Use Microdata File: Survey of Labour and Income Dynamics (SLID) – 2011, 2014.
6. Bureau of Labor Statistics, Average Retail Food and Energy Prices, U.S. and Midwest Region, 2016.
7. Statistics Canada, CANSIM Table 326-0012: Average retail prices for food and other selected items, 2016.
8. For further details, see the Technical Annex on the MEI’s website.
9. Christopher A. Sarlo, Poverty in Canada, Fraser Institute, 1992; Christopher A. Sarlo, Poverty: Where Do We Draw the Line? Fraser Institute, 2013, p. 35.
10. Income Statistics Division, Low Income Lines, 2011-2012, Statistics Canada, 2013, p. 6.

