The Economic Impact of Applying a Carbon Emissions Cap to the Oil and Gas Sector

Economic Note showing that an overly limited carbon market would destabilize our economy while threatening our energy security and that of our partners, with zero net reduction in global GHGs
This study from the MEI describes how the federal government’s proposal to cap the energy sector’s greenhouse gas emissions would cause substantial economic losses, without achieving any net reduction in global emissions.
 Related Content
 |
 |
 |
| Capping energy industry emissions is all pain, no gain (True North, November 14, 2022)
What does Ottawa get for killing the golden goose of Alberta’s energy production? (Calgary Herald, November 17, 2022) |
Interview with Renaud Brossard (The Roy Green Show, Global News Radio, November 13, 2022)
Interview with Olivier Rancourt (Shaye Ganam, Global News Radio, November 21, 2022) |
This Economic Note was prepared by Guillaume Tremblay, Associate Researcher at the MEI, in collaboration with Olivier Rancourt, Economist at the MEI. The MEI’s Energy Series aims to examine the economic impact of the development of various energy sources and to challenge the myths and unrealistic proposals related to this important field of activity.
In July 2022, the Canadian government published a discussion document proposing mechanisms to cap greenhouse gas (GHG) emissions by 2030.(1) Among these is a cap-and-trade system that would limit emissions for the oil and gas sector alone, considered in isolation from the rest of the economy.
Such a policy, if it were implemented, would likely entail a decline in production, which would have the effect of cutting the revenues of companies in the sector as well as their investments in new carbon capture technologies, thus actually reducing the chances of achieving carbon neutrality by 2050.
New Regulation for an Already Heavily Regulated Sector
The oil and gas sector is divided into three segments. The first is the upstream segment, often called “exploration and production,” which finds and extracts oil and gas; next is the midstream segment, which takes care of transportation by pipeline; and finally there is the downstream segment, responsible for petroleum refining and natural gas distribution.(2)
The government justifies the decision to apply a GHG emissions cap exclusively to the upstream segment based on its high GHG emissions. These represent 84% of the total emissions of the oil and gas sector, which is the biggest emitter in the Canadian economy, and 23% of Canada’s total emissions.(3)
The government recognizes that the oil and gas industry has already considerably reduced its GHG emissions. Oil sands extraction companies have reduced their GHGs per barrel produced by 33% since 1990. They also account for over half of investments in Canada’s energy transition(4) and the achievement of carbon neutrality.
According to the federal government, additional measures are nonetheless necessary in order to hit the ambitious GHG reduction targets of 40% by 2030 as compared to 2005.(5)
Yet the oil and gas industry is already subject to many regulations regarding GHG emissions, such as methane regulations,(6) clean fuel regulations,(7) and the federal carbon pricing program.(8)
The implementation of the new cap-and-trade system(9) for GHG emissions would therefore add to an already heavy regulatory burden. But applying such a measure to one sector in isolation from the rest of the economy would also go against the logic of how cap-and-trade systems work.
What Is the Purpose of a Cap-and-Trade System?
A cap-and-trade system is a mechanism that creates an artificial “market” to determine the price of a pollutant or undesirable product, in this case GHGs.(10) The public authorities, being unable to determine which companies and which technologies will be able to reduce emissions, settle for establishing a cap. They then grant emissions permits(11) to different companies, mainly through auctions. As the goal is to reduce emissions over time, they periodically lower the cap.
Contrary to a carbon tax where there is certainty about the price but uncertainty regarding the rate of GHG reduction, a cap-and-trade system provides policy-makers with certainty regarding the trajectory of emissions but makes the evolution of prices highly uncertain for economic actors overall.(12)
By capping the quantity of gas to be emitted and allowing the price to adjust continually in a multitude of trades throughout the economy, a kind of “market” is effectively created for the pollutant targeted for reduction. Once the market is operational, it becomes a costly factor of production. A company must either purchase a permit if it has none, or go without by finding an alternative to the pollutant.
Companies’ emissions must correspond, overall, to the number of permits available to them. If they want to increase their production, they must therefore buy additional permits from other companies, from the same sector or other sectors of the economy, or adopt a new technology that allows them to reduce the quantity of pollutant for a given level of production.
The system as a whole relies on the possibility, and even the necessity, of multiple trades between companies, preferably from all economic sectors, thus allowing the pollutant to be reduced by those who can do so in the least costly manner. Moreover, the possibility of profiting from the sale of permits represents an incentive to innovate and invest in new technologies to mitigate and reduce the pollutant.(13)
For a cap-and-trade system to be optimal, the possibility of trading permits is therefore essential. Yet this possibility of trading could prove severely limited if the cap is applied to a single sector, in isolation from the rest of the economy.(14)
Indeed, for companies to buy and sell permits among themselves, they need to have different cost and production conditions. If they all had access to the same mitigation technologies, they would have no reason to trade permits. This is why one of the essential conditions for favouring trade is for participating companies to have heterogeneous mitigation costs,(15) something that is more likely if the companies belong to different sectors.
Isolating the oil and gas sector, as the federal government proposes to do, therefore goes against the optimal operation of a cap-and-trade system for permits to emit GHGs (the “pollutant”), and could lead to a decline in production.
An Overly Limited Market
If the proposal were adopted, it would create a much too limited artificial market, with participants having very similar mitigation costs, since it would exclude companies from other sectors accounting for more than three quarters of Canada’s total GHG emissions.(16)
Yet one molecule of CO2 released into the atmosphere by the oil and gas sector has no greater climate warming potential than a molecule of CO2 emitted by a gas-powered car or emitted during industrial processes like the production of steel or cement. If the ultimate goal is the reduction of the atmospheric concentration of GHGs, it makes no difference which economic sector this reduction comes from. It is therefore illogical to consider the oil and gas sector alone and in isolation from the rest of the Canadian economy.
Nor is it certain that we will find, in the coming years, substitutes for fossil fuels to provide the energy for the machinery needed in oil and natural gas exploration and extraction. The Canadian government’s wish that the industry electrify its machinery and use low-carbon fuels in the production process will therefore not easily be fulfilled.
Indeed, despite the $5.416 trillion invested in the energy transition since 2004,(17) fossil fuels still represent 84% of the primary energy used worldwide.(18) Technological solutions for reducing GHG emissions on a large scale are also hard to come by.(19) For example, carbon capture, utilization, and storage (CCUS), a technology considered essential for the energy transition and the reduction of GHGs,(20) is far from being deployed on a sufficiently large scale to have a significant impact in the short term. Indeed, an estimated 7 to 10 years are needed for a CCUS project to be operational.(21) The majority of new projects begun today will therefore not contribute to GHG reductions before 2030.
The relative homogeneity of GHG emission mitigation costs for companies in a single sector, combined with the lack of available substitution technologies, greatly reduces the potential for buying and selling permits in a cap-and-trade system limited to the oil and gas sector alone.
The companies in this sector run the risk of all finding themselves in a situation where they need permits to produce, but none are prepared to sell any. A cap-and-trade system that limits the number of potential trades in this way could easily become simply a cap without trading, which would necessarily entail a decline in production if the emissions cap falls too quickly, in turn leading to several negative economic consequences.
The Economic Impacts of a Decline in Production
If the government decides to go ahead and impose a specific cap-and-trade system for the oil and gas industry alone, it is very likely that the cap selected will be based on what was proposed in the 2030 Emissions Reduction Plan, namely 42% below 2019 levels for the sector as a whole.(22) If the same reduction is applied to the upstream sub-sector targeted by the federal proposal, its cap for 2030 would be around 100 million tonnes (Mt) of emissions.(23)
This means that to maintain the 2019 level of production, the sector will have to reduce its GHG intensity, defined as the emissions produced during the production of one barrel of oil equivalent (boe), by 42% in order to respect the cap. Alternatively, if no new reduction in GHG intensity can be achieved by 2030, the industry will effectively have to reduce its production by 42%. An increase in the production of oil and gas would only be possible if GHG intensity were reduced by more than 42%, and the bigger the reduction in intensity beyond this amount, the more the sector would be able to increase production.
Figure 1 illustrates all the possible combinations of production as a function of GHG intensity per barrel produced corresponding to the 100 Mt cap in 2030. For example, 2.5 billion boe could be produced with a GHG intensity of 0.04 tonnes per barrel. If GHG intensity remains at 0.063 tonnes per barrel, only 1.57 billion barrels would be allowed on the market.(24)

According to the government’s conservative projections in a plan that accounts for the global reduction in demand for fossil fuels due to the energy transition, Canadian oil production should nonetheless increase by 18% between 2020 and 2030, while natural gas production should decrease by 3%.(25) Canadian production would therefore go from 2.71 billion boe in 2019 to 2.97 billion boe in 2030.(26)
In order to respect the proposed 2030 cap with this projected production of 2.97 billion boe, the GHG intensity of one barrel of oil equivalent will have to diminish even more, by 47% compared to the 2019 level.(27) As a result, any improvement in the GHG intensity of a barrel that is less than 47% would entail lower than projected production.
In order to calculate the economic impact of a potential cap on GHG emissions with production of 2.97 billion boe in 2030, three scenarios were examined (see Table 1):
- Scenario 1: No further improvement in terms of GHG intensity proves possible by 2030.
- Scenario 2: This scenario takes into account the goals already announced by the Pathways Alliance, made up of Canada’s six largest oil sands producers, to reduce GHG emissions by 22 Mt by 2030 using various technologies.(28) We postulate that these 22 Mt will be reduced using CCUS, which would allow an effective increase in the emissions cap from 100 Mt to 122 Mt.
- Scenario 3: The industry succeeds in improving its GHG intensity by 12% by 2030,(29) the same rate as between 2005 and 2020, in addition to the Pathways Alliance’s 22 Mt of reductions.
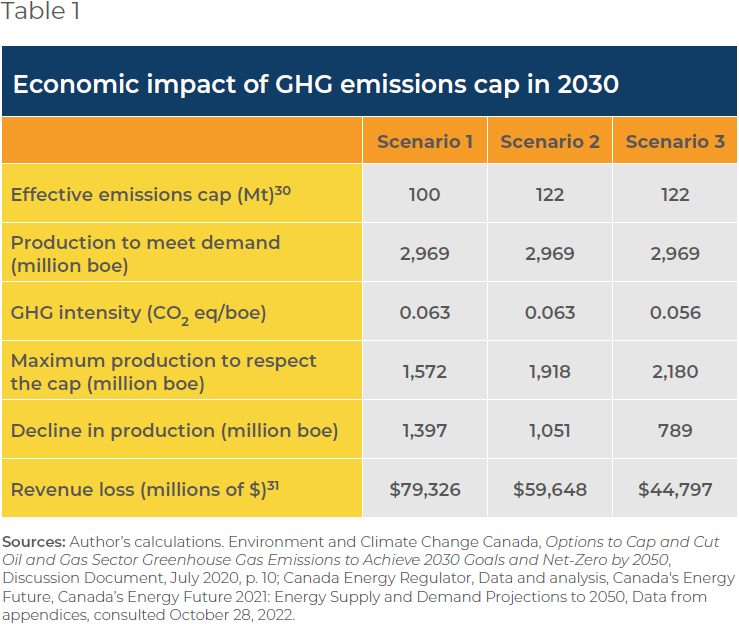
In Scenario 3, we estimate that at best, the impact will be a $44.8-billion reduction in revenues for the oil and gas industry just for the year 2030. In Scenario 1, the reduction would be over $79 billion. Considerable additional economic losses could occur before 2030, depending on the speed at which the cap is lowered.
There would therefore certainly be a reduction in exports to our trading partners, who would have to compensate for the lack of supply from Canada by importing oil and gas from other countries. In fact, the decline in production is such that it could represent the equivalent of our total current annual oil exports.(32)
In addition to threatening our energy security and that of our partners, the net reduction in global GHGs will be zero, and there might even be an increase, if the foreign production that replaces ours emits more GHGs per barrel.
Finally, the production declines risk depriving Canadian companies of the funds needed to make investments in new technologies and achieving carbon neutrality by 2050. It is estimated that between now and then, nearly $1 trillion will need to be invested in the installation of CCUS technologies,(33) and that the global capacity of these installations will need to be multiplied by 140.(34)
Conclusion
According to the Canadian government, the impact on GDP of achieving the 2030 objectives would be minimal: “considerably less than the average annual revision to GDP year over year.”(35) Our analysis demonstrates that this is not the case. In wanting to reduce GHGs by 2030, the federal government must avoid prematurely reducing oil and gas production, as this would not only destabilize the entire economy, but would also threaten the achievement of carbon neutrality by 2050.
References
- Environment and Climate Change Canada, Options to Cap and Cut Oil and Gas Sector Greenhouse Gas Emissions to Achieve 2030 Goals and Net-Zero by 2050, Discussion Document, July 2020.
- Ibid., p. 7.
- Author’s calculations. Ibid., pp. 17 and 8.
- Ibid., pp. 11 and 13.
- Ibid., p. 5.
- Government of Canada, Environment and natural resources, Pollution and waste management, Canadian Environmental Protection Act Registry, Canada’s methane regulations for the upstream oil and gas sector, April 26, 2018.
- Government of Canada, Environment and natural resources, Pollution and waste management, Pollution sources and prevention, Managing pollution, Fuel regulations: regulatory text, guidance, reporting, Clean Fuel Regulations, July 7, 2022.
- Government of Canada, Environment and natural resources, Climate change, Canada’s climate plan, Carbon pollution pricing, Carbon pollution pricing systems across Canada, How carbon pricing works, August 8, 2022.
- The decision between introducing a cap-and-trade system or a tax will be announced in early 2023.
- Richard Schmalensee and Robert Stavins, “Learning from Thirty Years of Cap and Trade,” Resources, May 16, 2019.
- The term “allowances” can also be used.
- Alice Lépissier and Owen Barder, “A Global Carbon Tax or Cap-and-Trade? Part 1: The Economic Arguments,” Center for Global Development, September 8, 2014.
- Cletus C. Coughlin and Lesli S. Ott, “Regulating Carbon Emissions: The Cap- and-Trade Program,” Federal Reserve Bank of St. Louis, October 1st, 2009.
- Gernot Wagner, “Cap-and-Trade Principles,” in Encyclopedia of Energy, Natural Resource, and Environmental Economics, 2013.
- Richard G. Newell and Robert N. Stavins, “Cost Heterogeneity and the Potential Savings from Market-Based Policies,” Journal of Regulatory Economics, Vol. 23, No. 1, 2003, p. 44.
- Author’s calculations. Environment and Climate Change Canada, op. cit., endnote 1.
- Author’s calculations. Bloomberg NEF, “Energy Transition Investment Trends 2022,” January 2022, p. 6.
- Hannah Ritchie, Max Roser, and Pablo Rosado, “Energy,” OurWorldInData.org, 2020.
- International Energy Agency, Energy Technology Perspectives 2020 – Special Report on Clean Energy Innovation, 2020, pp. 11-12.
- International Energy Agency, Energy Technology Perspectives 2020 – Special Report on Carbon Capture Utilization and Storage, 2020, p. 18.
- Global CCS Institute, Global Status of CCS 2021, October 2021, p. 12.
- Environment and Climate Change Canada, 2030 Emissions Reduction Plan: Canada’s Next Steps for Clean Air and a Strong Economy, 2022, p. 8.
- Namely a 42% reduction of the 172 Mt emitted by the upstream oil and gas sector in 2019. Author’s calculations. Environment and Climate Change Canada, op. cit., endnote 1, p. 10.
- 99,76 Mt / 0.063.
- Author’s calculations. Canada Energy Regulator, Data and analysis, Canada’s Energy Future, Canada’s Energy Future 2021: Energy Supply and Demand Projections to 2050, Data from appendices, consulted October 28, 2022.
- Author’s calculations. Environment and Climate Change Canada, op. cit., endnote 1, p. 10; Canada Energy Regulator, ibid.
- An emissions cap of 99.76 Mt / production of 2.97 billion boe = GHG intensity of 0.034 tonnes per barrel, which is a 47% reduction from the 0.063 tonnes per barrel in 2019.
- Environment and Climate Change Canada, op. cit., endnote 1, p. 13.
- Ibid., p. 10.
- Removing 22 Mt of GHGs from the atmosphere using CCUS allows the industry to produce 122 Mt of GHGs while respecting the 100 Mt cap.
- Based on the Canadian government’s projection of $56.77 for a barrel of Western Canadian Select in 2030. Canada Energy Regulator, op. cit., endnote 25.
- Average oil exports over the past three years amounted to 1.111 billion barrels. International Energy Agency, Crude oil net exports in Canada, 2000-2020, October 26, 2022.
- Global CCS Institute, op. cit., endnote 21.
- Author’s calculation. Ibid.
- Environment and Climate Change Canada, op. cit., endnote 22, p. 197.