Christmas Costs Less Than It Used To

With Christmas around the corner, stories about consumption and purchasing power tend to make headlines. Often, we’re told that “everything is more expensive” or that “our purchasing power is stagnating.” What are the facts of the matter?
 Related Content
 |
 |
 |
| Noël est en solde! (Le Soleil, December 22, 2018)
Christmas is on sale! (www.iedm.org, December 27, 2018) |
Report (in French) with David Descôteaux (Le TVA 18 h, TVA-TV, December 21, 2018) |
This Viewpoint was prepared by David Descôteaux, Public Policy Analyst at the MEI.
With Christmas around the corner, stories about consumption and purchasing power tend to make headlines. Often, we’re told that “everything is more expensive” or that “our purchasing power is stagnating.” What are the facts of the matter?
Discussions of purchasing power often focus on the evolution of salaries or of prices. Yet this kind of comparison obscures an important factor that keeps raising our capacity to purchase goods: productivity. Indeed, when purchasing power is evaluated by measuring the cost of goods and services in terms of hours of work needed to purchase them, the picture changes considerably. By this measure, there is a big difference between what people can consume today and what they could consume three decades ago.
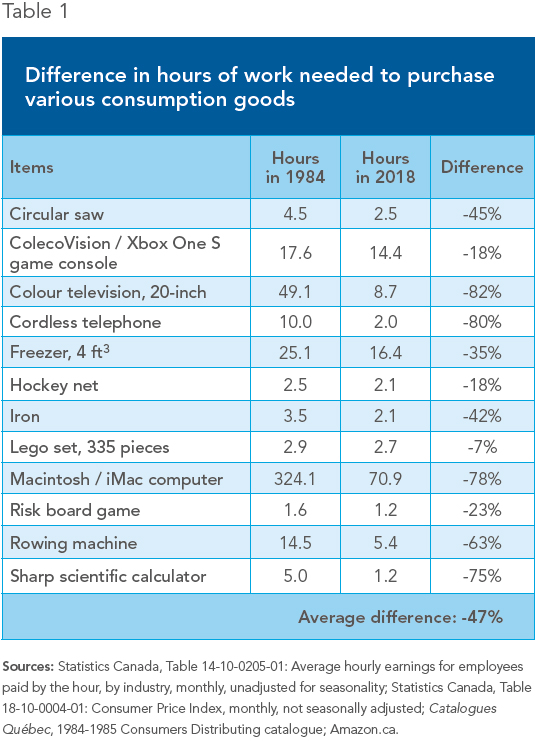
To illustrate this oft-ignored fact, we have compared the prices in 2018 of a basket of goods that could be offered today as Christmas gifts with the prices of these same goods back in 1984.(1) To properly measure purchasing power, we have also taken into account the average hourly wage of Canadian workers in 1984 with the average wage in 2018.(2) We have thus been able to establish how much time an individual had to work back then to pay for a video game console or a television, for example, and how much time an individual has to work today to purchase the same good, or its closest equivalent. The comparison is not intended to be strictly scientific, but it is nonetheless illuminating.
Time Is Money
For example, to buy a 20-inch cathode-ray tube colour television, a worker had to work 49 hours in 1984, or more than a full workweek. In 2018, a worker could buy a 20-inch flat screen colour television by spending just nine hours on the job, barely more than a single day of work. (The same television can also be ordered online, from the comfort of home!)
A cordless telephone for the home required almost ten hours of work in 1984. In 2018, just two hours and a quarter would suffice for a similar, but superior, product. In the same vein, a Sharp scientific calculator cost a worker in 1984, in terms of hours worked, four times more than a worker in 2018. And the “scientific” calculator back then had 61 functions… versus 640 for today’s version!
Even for consumption goods without a significant technological component, today’s shopper stands to save, if somewhat less spectacularly. For instance, a small freezer (4 ft3) required 25 hours of work in 1984, compared to 16 hours today. The hours of work needed to buy a circular saw (4.5 hours in 1984 versus 2.5 hours in 2018) or an iron (3.5 hours in 1984 versus 2 hours in 2018) have also fallen substantially. For certain goods, however, the cost in hours worked today is almost the same as it was in 1984. For example, a 335-piece Lego set cost 2.9 hours of work in 1984, while another set, with the same number of pieces, costs 2.7 hours of work today.
Thus, by reconstructing a basket of goods that could be found underneath a family’s Christmas tree (see Table 1), we can see that the goods in the 2018 basket cost around half of what those from 1984 cost, measured in hours of work—the average difference being 47%.(3) Moreover, in the great majority of cases, today’s goods are of higher quality and have more functions. Most also use less energy and are less polluting than their equivalent predecessors (think of automobiles, for instance, or certain household appliances). Some “modern” devices may not last as long, but when we take into account their relatively low prices compared to their 1984 versions, the savings tend to amply compensate for the shorter lifespans, when they are shorter.
Why Are Living Standards Rising?
If the cost of typical consumer goods in terms of hours worked has tended to fall over time, it is mainly because of the general increase in productivity. Indeed, capital investments over the years on the part of businesses, as well as techno- logical innovation, lead to large increases in the productivity of both machines and workers, with the latter having better tools to work with.(4)
To this must be added the growth of human capital, namely the knowledge and skills that workers acquire through education, training, and experience, which raise the value of work, and as a result, the average wage.(5) The competition and efficiency gains entailed by international trade have also contributed to the phenomenon.(6) Actually, even ignoring the calculation of hours worked, prices adjusted for inflation for many of these goods are lower than they were a generation ago.(7) The final result is that over time, the average Canadian worker improves his or her real purchasing power per hour worked.
We sometimes have the impression that the average worker has trouble making ends meet, and this is true in some regards: The price of housing, for example, can be a challenge in certain cities. This should not blind us to the fact that in many regards, this worker has never been richer, and this increased wealth is due in large part to an economic environment that is favourable to trade and investment. It would be a welcome Christmas gift for our politicians to further encourage the widespread benefits of economic growth.
References
1. To this end, we have assembled a basket for a family composed of gifts for children and adults. To show the effect of the increase in purchasing power independent of the arrival of new technologies, we have included a significant number of non-tech products.
2. The year 1984 is the second earliest for which data on the average hourly wages of Canadian workers (drawn from Statistics Canada’s SEPH) are available for all sectors. The data are for employees paid by the hour (full-time and part-time) and do not include overtime. This same year also allows for comparison with the prices listed in the 1984-1985 Consumers Distributing catalogue, available in French on the Catalogues Québec website.
3. We decided to simply add all the differences and then take the unweighted average of the total, such that an iron counts for as much as an iMac computer in the calculation. The savings would be even greater if we had weighted the results based on the prices of the goods: In 1984, the average worker had to devote three and a half times more hours than today for the entire basket.
4. Statistics Canada, Table 36-10-0208-01: Multifactor productivity, value-added, capital input and labour input in the aggregate business sector and major sub-sectors, by industry, consulted November 30, 2018.
5. N. Gregory Mankiw, Germain Belzile, and Benoît Pépin, Principes de macroéconomie, 2e édition, Modulo, 2014, pp. 140-141.
6. Mathieu Bédard, “NAFTA: Donald Trump’s Criticisms Are Unfounded,” Viewpoint, MEI, July 2016.
7. Steven Horwitz, “Inequality, Mobility, and Being Poor in America,” Social Philosophy and Policy, Vol. 31, No. 2, spring 2015, p. 81. While the study cited looks at the United States, the phenomenon at work is generally the same in Canada.