Lessons from Ranking the Fiscal Performance of Quebec Premiers Since 1944

Economic Note examining the spending records of past governments in order to learn how to return to fiscal discipline in the wake of the pandemic
Former Premier Jacques Parizeau takes the top prize in terms of fiscal responsibility, according to this ranking of Quebec premiers since 1944 published by the MEI. The size of the Quebec government reached a historic high of 28% of GDP last year. François Legault is ranked 12th out of 14 premiers in terms of fiscal responsibility.
 Related Content
 |
 |
 |
| Rigueur budgétaire dans l’histoire: Parizeau devant Couillard (La Presse+, November 30, 2022) | Interview (in French) with Vincent Geloso (Mario Dumont, QUB Radio, November 29, 2022) |
This Economic Note was prepared by Vincent Geloso, Senior Economist at the MEI, assistant professor of economics at George Mason University, and associate with the Center for the Study of Public Choice. The MEI’s Taxation Series aims to shine a light on the fiscal policies of governments and to study their effect on economic growth and the standard of living of citizens.
In the current fiscal year (2022-2023), government spending in Quebec accounts for 26.3% of the province’s entire economy. This represents the third highest proportion recorded since GDP numbers for Quebec first became available in 1926.(1) The prizes for first and second place belong to the two years preceding this one. The unprecedented magnitude of these spending levels has been due mainly to the COVID pandemic, but with the crisis now largely behind us the time has come to return to fiscal discipline.
But how exactly should we proceed toward this goal? To answer this, it can be very informative to look at the spending records of past premiers in Quebec in order to identify the time periods that saw efforts at fiscal discipline, and to consider their results. There are lessons to be drawn from our history.
Ranking the Premiers
To rank the fiscal performance of the different premiers of Quebec, we must first assemble data reflecting government spending. Since 2009, Quebec’s Department of Finance has provided estimates going back to fiscal year 1970-1971.(2) For the period from 1944 to 1969, we rely on the work of economic historian Ruth Dupré, who combed through the accounts of expenditures and receipts and organized them according to a single accounting methodology.(3) We must then rescale the fiscal year to the calendar year.
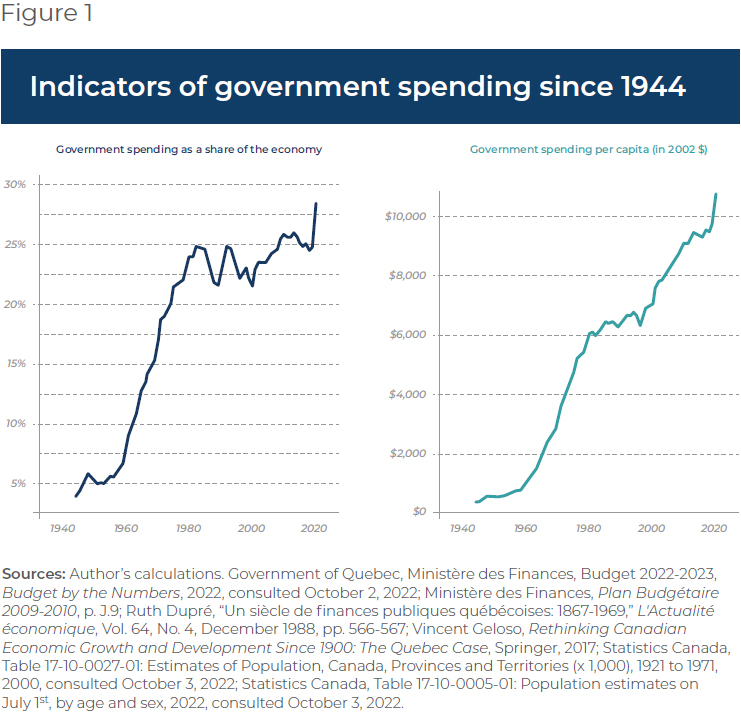
The next step consists in creating measures of fiscal performance. There are two possible ways to do this. The first is to divide government spending by estimates of GDP. Such estimates are available at the provincial level from 1926 onward.(4) The second is to adjust government expenditures to account for inflation,(5) and then divide on a per capita basis.(6)
Both measures have their strengths and weaknesses. Government spending as a share of GDP captures the share of economic resources managed by the state and is the measure most often used to connect the extent of state involvement in the economy to economic growth. If governments take too large (or too small) a share of economic resources, they tend to slow down economic growth.(7) As such, this measure carries important meaning.
However, it has flaws in terms of assessing fiscal discipline. For example, during a recession government spending could remain stable, but the falling GDP will cause the ratio to increase nonetheless. This increase during recessions is to be expected as a standard stylized fact in macroeconomics.(8)
For this reason, we also employ the level of spending per capita. This measure better captures the efforts of politicians to control spending, but it too can be problematic if taken alone. For example, some reduction in public spending may be achieved by allowing spending to remain stable on a per capita level while the economy grows, or even to increase so long as the economy increases faster. Thus, the strengths of one measure are the weaknesses of the other, so their joint use is warranted.
The resulting series are depicted in Figure 1. As can be observed, there was a significant increase in government spending from the late 1950s onward that paused in the early 1980s. Since then, provincial government spending as a share of the economy has hovered between 22% and 28% with no clear sign of either upward or downward trends, while per capita expenditure has increased more modestly than during the 1960s and 1970s.
With this data assembled, we can create our ranking of the premiers. To do so, we take the average change across their mandates. In cases in which there were two premiers in one year (e.g., Jean Charest and Pauline Marois in 2012), we assigned the year to the premier who was in office for more than half of the year. We also excluded all premiers who were in office less than one year (this excludes four short-lived premierships).
This gives us 14 premiers to rank since 1944. The results appear in Table 1. The first four columns show the change in the ratio of government spending to GDP and the change in government spending per capita as well as the ranks in each of these two categories. The fifth column takes the sum of the ranks for the two categories so as to create an aggregate rank.
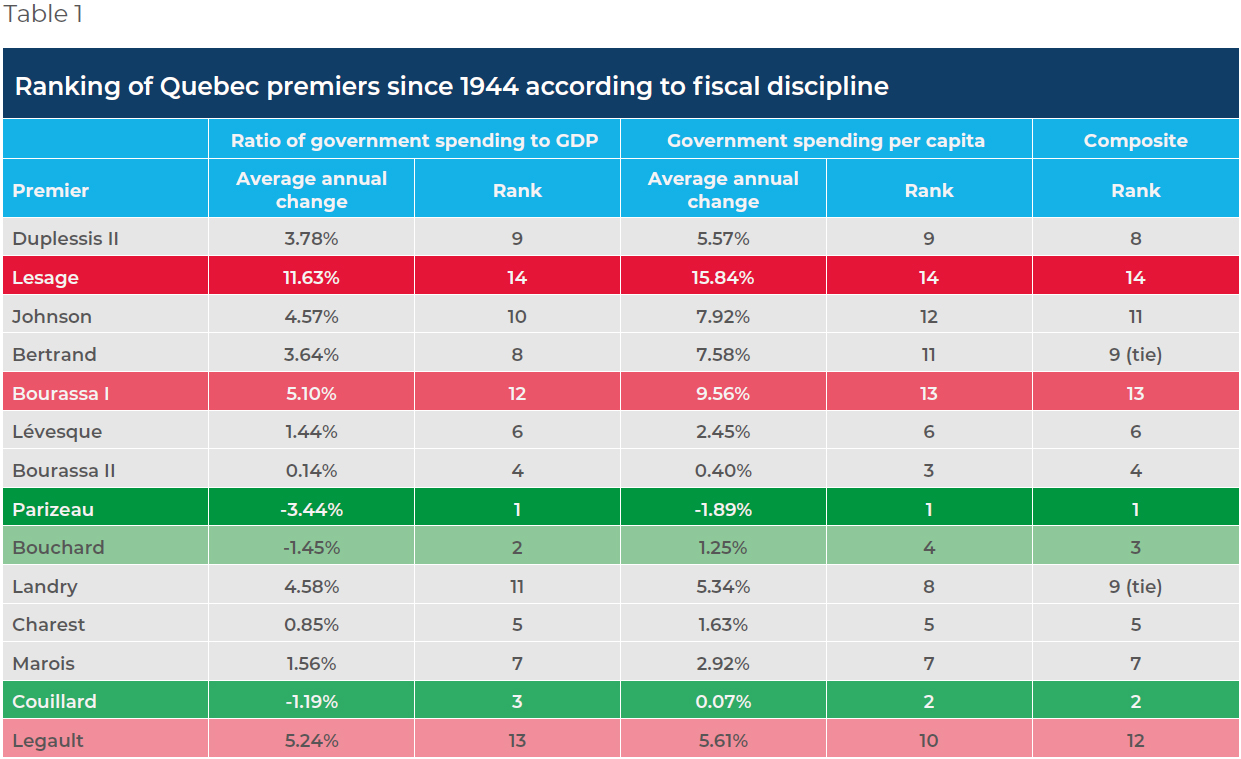
There are some surprises. First off, premiers who have generally been considered fiscally hawkish, such as Maurice Duplessis (1944-1959) and Jean Charest (2003-2012), are nowhere near the top of the ranking.(9) Secondly, some of the fiscal champions are also unexpected. The top three spots are occupied by Jacques Parizeau (1994-1996), Phillipe Couillard (2014-2018) and Lucien Bouchard (1996-2001).
Lessons
These rankings provide lessons about how to return to fiscal discipline in the wake of the pandemic, and these emerge when we look at two out of the top three. While Jacques Parizeau’s reign was indeed accompanied by a noticeable effort to contain government expenditures, it was too short to draw fiscal conclusions from. However, the other two top performers (Couillard and Bouchard) are easier to compare. To do this, we create a scenario in which spending is only allowed to grow in line with inflation and population growth starting in the first year of the government’s arrival in power.
Under Lucien Bouchard, expenditures per capita were cut by 2.95% in the first year. After that, he did allow expenditures to grow right up until his resignation in 2001, but at a slightly slower rate than the economy as a whole.(10) As such, there was a reduction in spending relative to GDP. In contrast, under Phillipe Couillard inflation-adjusted expenditures per capita actually declined in the first years and were then kept more or less stable. The result was that government spending as a share of the economy fell even faster than under Bouchard.
Let us thus imagine two scenarios for returning to fiscal discipline: the Bouchard scenario (significant spending cuts in the first year and increases thereafter at three quarters of the speed of economic growth), and the Couillard scenario (spending per capita increases only in line with inflation). We can calculate how quickly each method would return us to pre-pandemic spending levels relative to GDP (that is, the level in 2019, which stood at 24.8% instead of 28.3% for the calendar year 2021). In both scenarios, we assume a nominal GDP growth rate of 5.8% per year.
As can be seen from Figure 2, the method that imitates premier Bouchard’s approach would bring Quebec back to pre-pandemic spending levels by the year 2030, while the Couillard method would achieve the same result by 2026. In fact, if extended to 2030, the Couillard scenario would bring Quebec’s spending back to the levels observed in the late 1990s.
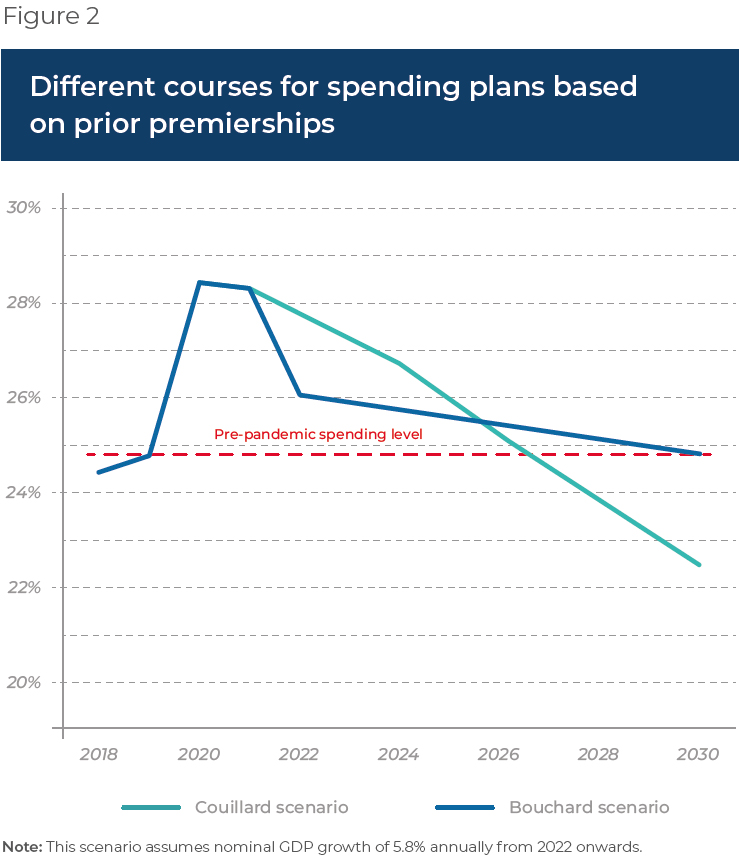
How do these scenarios compare with the current projected course of Quebec’s government? According to the last budgetary plan, spending is expected to grow at 3.2% per year until 2027.(11) Such an expenditure path is much closer to the Bouchard scenario than the Couillard scenario. This entails that it will take roughly a decade for Quebec to return to the pre-pandemic starting point, a level that was already quite high even by Quebec’s historical standards. Under a more ambitious rule, the time required would be nearly halved. Moreover, spending levels would be $1,956 lower on a per capita basis. The total amount of the difference between the two scenarios is $18 billion.
Conclusion
The pandemic was an exceptional episode that was bound to have an effect on fiscal discipline. History teaches us that crises will occasionally take place, and that they will necessitate some fiscal expansion by government. However, this means that we must put our fiscal house in order ahead of time. Our own history shows that there are better ways to clean things up after a crisis than the ones we are using today.
References
- Author’s calculation. Government of Quebec, Ministère des Finances, Budget 2022-2023, Budget by the Numbers, 2022, consulted October 2, 2022.
- Ministère des Finances, Plan Budgétaire 2009-2010, p. J.9.
- Ruth Dupré, “Un siècle de finances publiques québécoises : 1867-1969,” L’Actualité économique, Vol. 64, No. 4, December 1988, pp. 566-567.
- Vincent Geloso, Rethinking Canadian Economic Growth and Development Since 1900: The Quebec Case, Springer, 2017. Note: In this work, I covered government spending up to 2016. The most recent estimates of ratios of government spending to GDP from the Ministère des Finances were used to update the data.
- Statistics Canada, Table 18-10-0005-01: Consumer Price Index, annual average, not seasonally adjusted, 2022, consulted October 3, 2022.
- Statistics Canada, Table 17-10-0027-01: Estimates of Population, Canada, Provinces and Territories (x 1,000), 1921 to 1971, 2000, consulted October 3, 2022; Statistics Canada, Table 17-10-0005-01: Population estimates on July 1st, by age and sex, 2022, consulted October 3, 2022. The two statistical series for population are estimated differently and so they do not match perfectly in 1971. We averaged the two series in that year to merge them.
- Livio Di Matteo and Fraser Summerfield, “The shifting Scully curve: international evidence from 1871 to 2016,” Applied Economics, Vol. 52, No. 39, March 2020, pp. 4263-4283; Gerald W. Scully, “The size of the state, economic growth and the efficient utilization of national resources,” Public Choice, Vol. 63, No. 2, November 1989, pp. 149-164; Atrayee Gosh Roy, “Evidence on economic growth and government size,” Applied Economics, Vol. 41, No. 5, 2009, pp. 607-614; Antonio Afonso and Davide Furceri, “Government size, composition, volatility and economic growth,” European Journal of Political Economy, Vol. 26, No. 4, December 2010, pp. 517-532; Andreas Bergh and Magnus Henrekson, “Government size and growth: a survey and interpretation of the evidence,” Journal of Economic Surveys, Vol. 25, No. 5, June 2011, pp. 872-897.
- Carlin Wendy and David Soskice, Macroeconomics: Imperfections, Institutions & Policies, Oxford University Press, 2006; Frank Garmon Jr, Vincent Geloso, and Phillip Magness, “Divided government and the bias against presidential restraint,” Social Science Journal, September 2020, pp. 1-18.
- It is worth pointing out that the early years of the Duplessis regimes are probably tainted by the fact that war years hindered the accuracy of GDP numbers (see Robert Higgs, “Wartime Prosperity? A Reassessment of the US Economy in the 1940s,” The Journal of Economic History, Vol. 52, No. 1, March 1992, pp. 41-60; Vincent Geloso and C.P. Pender, “The Myth of Wartime Prosperity: Canadian Evidence,” Working Paper, 2022). However, the length of his mandate means that the two problematic war years (1944 and 1945) and the immediate post-war adjustment years (1946 and 1947) make little difference. When we excluded these years for robustness checks, the ranking was unchanged.
- Spending grew about 10% more slowly than economic activity over the 1997- 2000 period.
- Ministère des Finances, Plan Budgétaire 2022-23, March 2022, p. A21.