Labour Shortages: Helping a Trapped Pool of Potential Workers Help Themselves

Economic Note showing how Canada’s approach to providing income support traps the very people it is intended to help with a perverse incentive structure that creates daunting barriers to employment
The federal and provincial governments should make the reduction in social benefits more gradual in order to encourage employable welfare beneficiaries to join the labour market, concludes this MEI study.
 Related Content
 |
 |
 |
| Réduire les prestations sociales progressivement pour inciter à travailler (Le Journal de Montréal, February 9, 2023)
The inactivity trap: Would you leave welfare for $4.61/hr? (Financial Post, February 15, 2023) Reduce welfare clawback to increase workforce: MEI (The Suburban, February 15, 2023) |
Interview (in French) with Renaud Brossard (Mario Dumont, QUB Radio, February 9, 2023) |
This Economic Note was prepared by Jason Dean, Associate Researcher at the MEI and Assistant Professor of Economics at King’s University College at Western Ontario, in collaboration with Célia Pinto Moreira, Public Policy Analyst at the MEI. The MEI’s Taxation Series aims to shine a light on the fiscal policies of governments and to study their effect on economic growth and the standard of living of citizens.
In recent months, many of us have experienced the frustration of long lines at Tim Hortons, frequent out-of-stock messages when shopping online, or having to take the day off work to visit Service Canada. Normally, the abundance of help wanted signs everywhere would be an indication of a healthy, growing economy. But these days, they remind us of the continuing labour shortage that is slowing down our economy, with unemployment figures at 40-year lows and record-setting job vacancies.
The unemployment-to-job vacancy ratio, a measure of the number of unemployed people per job opening, reached an all-time low of 1.4 in the first quarter of 2022, with all provinces experiencing a decline.(1) Labour shortage patterns are found in all major sectors of the economy and seem to be getting worse. Employers are unable to fill roughly one million vacancies, and expectations of shortages are a leading concern for the immediate future.(2)
The trend is no doubt the result of an aging population, exacerbated by the pandemic, which has wreaked havoc on global supply chains and led to sizable shifts between occupations, with many fleeing jobs in accommodation and food services.(3) However, there is another overlooked culprit: an income support system that encourages long-term dependency through perverse economic incentives which trap many able-bodied recipients in a vicious cycle of poverty. The cumulative effect of decades of these programs that disincentivize work has been to sideline potentially productive workers and leave them with little hope of escaping.
Social Assistance in Canada
Income support in all provinces is provided through various social assistance programs which are considered a safety net of last resort intended for those who have exhausted all other sources of financial support. Jurisdiction rests with the provinces and territories, with each having its own programs which differ in terms of administration, eligibility criteria, and benefit provisions. However, their fundamental features and structure are similar across the country, providing direct cash payments and in-kind benefits such as dental, vision, drug, and supplemental health care.
If recipients decide to work, their social assistance payments are reduced when they exceed a certain earnings threshold. Income earned above this threshold is subject to sharp clawback rates for social assistance payments, typically between 50% and 100% depending on the province.(4) Moreover, an employed recipient must pay income taxes and contribute to Employment Insurance and the Canada Pension Plan. A recipient could also face additional reductions if they are living in rent-geared-to-income housing, and those who work full-time face losing their in-kind benefits.
Perverse economic incentives trap many able-bodied recipients in a vicious cycle of poverty.
Clearly, these substantial penalties, coupled with the disutility of work and the loss of leisure, disincentivize work and substantially raise a recipient’s “reservation wage,” which is the minimum acceptable wage at which they will find it worthwhile to work. This is the core issue behind why recipients become trapped.
Several Canadian studies corroborate the existence of a such a trap. Benefits levels are associated with longer duration on social assistance,(5) and tend to foster continued reliance on support,(6) not only for current recipients, but across generations as well.(7) For instance, in Ontario, only 1% of recipients leave the program for work in any given month, and 20% remain on the program for more than five years.(8) In Quebec, there is roughly a 30% chance that children of social assistance recipients will also collect benefits in early adulthood. This perpetual dependence is commonly referred to as a “welfare trap.”
An Untapped Pool of Employable Labour
In Canada, roughly 8% of the population benefits from income support programs.(9) Ontario and Quebec combined represent about 70% of Canadian recipients. Figure 1 shows the breakdown of recipients by family type and their potential for employability. The first bar shows the breakdown by household type. By far, the largest uptake of social assistance is among unattached singles, at 77% (83% for Quebec, 73% for Ontario).
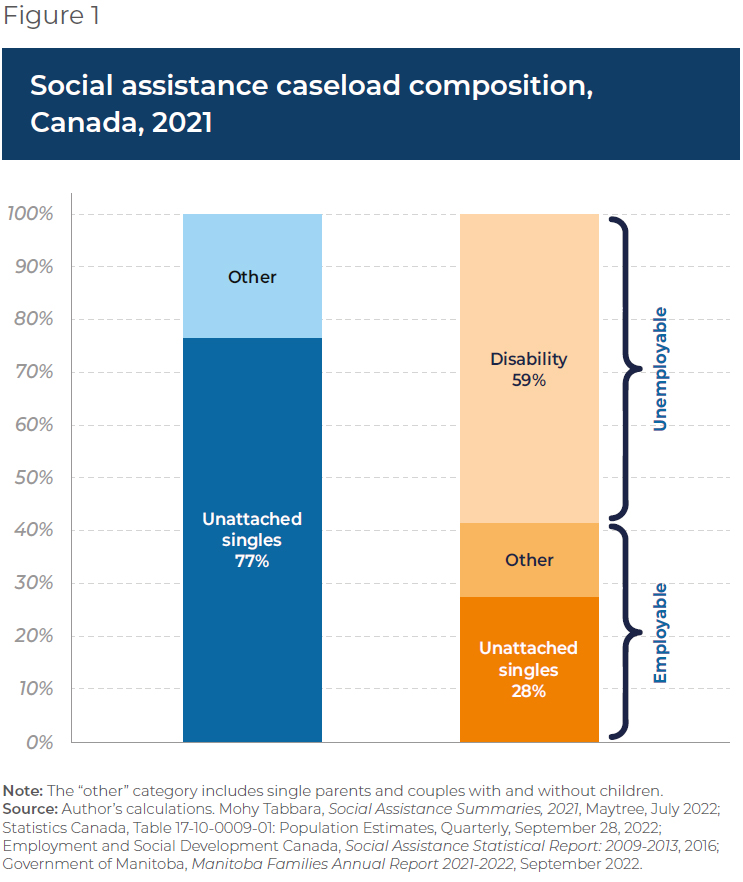
The second bar shows the breakdown of cases into employable and unemployable. For Canada as a whole, roughly 60% of recipients are enrolled in a province’s disability program where there are no expectations to find employment. The proportion of recipients in this category varies across provinces. (It is 17 percentage points lower in Quebec than in Ontario, which reflects differences in the
criteria used to determine disability status.)
Employable recipients are encouraged to engage in activities that will help them integrate into the labour market. The largest component of those employable are unattached singles, accounting for 28% of all recipients for Canada as a whole (39% for Quebec). The total number of Canadians in this category in 2021 was 348,946,(10) representing a substantial pool of untapped labour that could ease the current shortage.
The participation tax rate (PTR) shows the cumulative effect of all taxes and benefit reductions for a recipient who decides to work.
Why are so many employable but not working? The best way to answer this question is to explicitly quantify the disincentive to work. This involves a comparison of what must be given up versus what is retained of employment earnings. Some recent studies have quantified the disincentive by calculating the marginal effective tax rate (METR), which captures the loss from income taxation and benefit reduction associated with an additional dollar of employment income.(11) It specifically reflects the disincentive for someone already employed to take on extra work. These studies reveal that low-income families can actually face an METR as high as 60%, much larger than that faced by high-income families.
In the context of the welfare trap, the focus instead is on the incentives surrounding the transition from inactivity to employment. Also, workers generally cannot choose their hours worked on the margin, but rather decide to work either part-time or full-time. The disincentive in this scenario is better quantified by calculating the participation tax rate (PTR) which shows the cumulative effect of all taxes and benefit reductions for a recipient who decides to work. The PTR shows the percentage of gross employment income that is taken away in the form of reduced benefits (cash and in-kind) and changes in net taxation (such as changes in income tax payable and non-refundable provincial and federal tax credits).
The Disincentive to Work in Ontario and Quebec
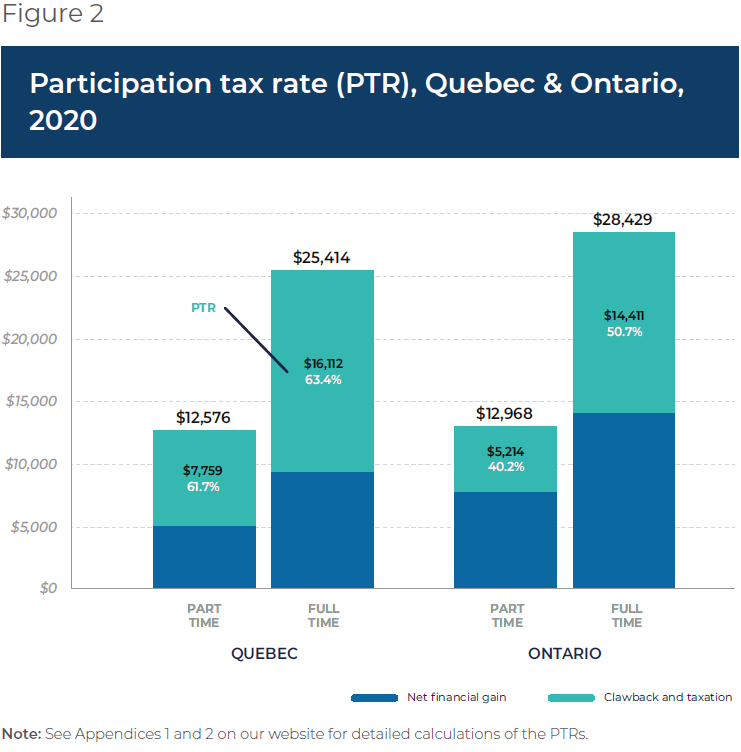
The PTR varies from province to province. Figure 2 shows the PTRs for Ontario and Quebec in 2020. These two provinces cover 70% of the Canada-wide caseload, with Quebec offering an illustration of the most generous province, and Ontario providing a level of benefits equal to the average across other provinces.(12) The rates are calculated for employable unattached singles for part-time and full-time employment scenarios.
The employment earnings used in the calculation are based on what a recipient could earn at the minimum wage. This reflects their relatively lower education levels and work experience, which limit their opportunities to secure high-paying jobs.(13) To accurately capture all relevant benefits and opportunity costs associated with the transition between inactivity and work, the calculations incorporate all changes in income tax, provincial and federal tax credits, and supplementary health care costs.
In Quebec, whether recipients work part-time or full-time, the PTR is just over 60%, meaning they keep less than 40% of any income they earn. In Ontario, the disincentive is somewhat less severe, especially for part-time workers who face a PTR of about 40%. However, a recipient who decides to work full-time at the minimum wage will still lose just over half of their employment income.
The main reason behind the much lower PTR in Ontario for part-time workers is the much higher clawback rate in Quebec. Both provinces have a monthly earnings exception of $200, but the clawback rate in Quebec is 100% versus only 50% in Ontario.(14) In fact, the part-time PTR in Quebec would fall to roughly 20% if the clawback rate were reduced to 50%.(15) Despite the differences in clawback rates, in both provinces, working full-time exhausts all social assistance benefits. Since Ontario’s benefits are less generous, recipients lose less when they work, which is why the Ontario PTR for full-time workers is lower than Quebec’s.
To put some flesh on these numbers and provide further insight, the height of each bar in Figure 2 shows gross employment income, and is simply broken down into the proportion that is relinquished due to clawbacks and changes in taxation (top portion), and the net financial gain or amount kept (bottom portion). For instance, a Quebec recipient who transitions off social assistance into full-time work at the minimum wage (the second bar in Figure 2) would lose a whopping $16,112 (63.4%) of their $25,414 in employment earnings. In other words, their net financial gain from working full time for the entire year is only $9,302 (36.6%).
It is important to note that these PTRs are a conservative estimate of the disincentive effect facing recipients. The real disincentives can be much more severe because the calculations presented here do not incorporate increases in rent payments for those living in subsidized housing where their rent is geared to their income. Work-related expenses such as transportation, uniforms, and new clothing all further reduce the net gain to working. Moreover, there are other more intangible considerations such as the disutility of work, which is conceivably quite high given the low educational levels among recipients that limits their opportunity to secure more interesting, meaningful work. Thus, employment for many entails a sacrifice of valuable leisure for time spent working in potentially unpleasant and unstimulating work environments.
Conclusion
Canada’s approach to providing income support is a failure. Rather than alleviate poverty, it traps the very people it is intended to help with a perverse incentive structure that creates daunting barriers to employment. This is especially disheartening when considering the heavy annual burden these programs impose on taxpayers, some $44 billion in 2020.(16) Moreover, the extent of the labour shortages we are experiencing would be significantly less severe if just the pool of roughly 350,000 employable unattached singles contributed their labour.
There is no easy solution. A policy that completely removes any clawbacks and allows recipients to unconditionally retain their benefits would solve the welfare trap, but would be both expensive and unfair to those working and not collecting benefits, and would entice many to find ways to become eligible for social assistance. However, the above analysis suggests that there is significant room for improvement within the current policy framework. Two of the largest provinces, Quebec and British Columbia, claw back 100% of recipient earnings; as we saw for Quebec above, cutting this in half can go a long way toward incentivizing part-time work. Increases in monthly earnings exceptions would provide an additional punch.
The labour shortages we are experiencing would be significantly less severe if just the pool of roughly 350,000 employable unattached singles contributed their labour.
The incentive for full-time work could be improved by increasing the amount and payment structure of the Canada Worker Benefit, a federal wage subsidy for low-income workers.(17) In its current form, the subsidy is completely exhausted at a level of income lower than what is earned full-time at the minimum wage. Also, since the benefit is delivered through the income tax system, a significant disconnect exists between the work decision and its reward. A more immediate, monthly payment would conceivably have a stronger impact on work incentives.
Finally, current policies surrounding education and training are focused on the short term. In most provinces, recipients are not allowed to enroll in post-secondary education. To meet the often-stated and laudable goal of encouraging self-sufficiency, recipients should have access to educational programs aligned with the needs of employers in a knowledge-based economy like Canada’s.
References
- Statistics Canada, Labour Shortage Trends in Canada, November 18, 2022.
- Robert Fair et al., “Analysis on Labour Challenges in Canada, Second Quarter of 2022,” Analysis in Brief, June 23, 2022.
- Claire Fan, Nathan Janzen, and Naomi Powell, “Canada’s Post- Pandemic Labour Market Shakeup,” RBC Thought Leadership, April 14, 2022.
- Jennefer Laidley and Mohy Tabbara, “Appendix 2: Earnings exemptions,” in Welfare in Canada, 2021, Maytree, November 2022.
- Bernard Fortin, Guy Lacroix, and Simon Drolet. “Welfare benefits and the duration of welfare spells: evidence from a natural experiment in Canada,” Journal of Public Economics, Vol. 88, Nos. 7-8, July 2004, pp. 1495-1520.
- Olivier Bargain and Karina Doorley. “Caught in the trap? The disincentive effect of social assistance,” IZA Discussion Paper No. 4291, July 21, 2009, p. 22; Thomas Lemieux and Kevin Milligan, “Incentive effects of social assistance: A regression discontinuity approach,” Journal of Econometrics, Vol. 142, No. 2, February 2008, pp. 807-828; Jorgen Hansen and Magnus Lofstrom, “The Dynamics of Immigrant Welfare and Labor Market Behavior,” Journal of Population Economics, Vol. 22, No. 4, August 2009, pp. 941-970; Martin Cooke, “A Welfare Trap? The Duration and Dynamics of Social Assistance Use Among Lone Mothers in Canada,” Canadian Review of Sociology, Vol. 46, No. 3, August 2009, p. 202.
- Nicolas Beaulieu et al., “Intergenerational reliance on social assistance: Evidence from Canada,” Journal of Population Economics, Vol. 18, No. 3, September 2005, p. 559.
- Government of Ontario, Backgrounder: Reforming Social Assistance, Children, Community and Social Services, November 22, 2018.
- Author’s calculations. Mohy Tabbara, Social Assistance Summaries, 2021, Maytree, July 2022; Statistics Canada, Table 17-10-0009-01: Population Estimates, Quarterly, September 28, 2022.
- Author’s calculations. Ibid.; Employment and Social Development Canada, Social Assistance Statistical Report: 2009-2013, 2016; Government of Manitoba, Manitoba Families Annual Report 2021-2022, September 2022.
- Philip Bazel, Marginal Effective Tax Rates Across Provinces: High Rates on Low Income, Fraser Institute, August 27, 2019, p. 6; Alexandre Laurin, “The Paycheck Blues: Why Extra Work is often Not Worth the Effort for Lower-income Families,” C.D. Howe Institute, E-Brief, August 22, 2019, p. 1; Michael Wolfson, “How a Guaranteed Income Could Work,” Policy Options, July 5, 2018.
- The figures are based on 2020 data and so are not confounded by the effects of pandemic-related benefits.
- Dean Herd, Yuna Kim, and Christine Carrasco, Canada’s Forgotten Poor? Putting Singles Living in Deep Poverty on the Policy Radar, Institute for Research on Public Policy, IRPP Report, September 2020, p. 2; Ernie Lightman, Andrew Mitchell, and Dean Herd, “Cycling Off and On Welfare in Canada,” Journal of Social Policy, Vol. 39, No. 4, October 2010, p. 526.
- Jennefer Laidley and Mohy Tabbara, op. cit., endnote 4.
- This figure is obtained by the claw back rate from 100% to 50% in the third panel of Appendix 1 and re-calculating the figures.
- Author’s calculations. Statistics Canada, Table 10-10-0017-01: Canadian government finance statistics for the provincial and territorial governments (x 1,000,000), November 2, 2022.
- Mohy Tabbara, What is the Canada Workers Benefit, and how could it be better? Maytree Foundation, October 20, 2021, pp. 13-22.