For a Better CPI Indicator in Canada

Economic Note showing the systematic underestimation of inflation due to the insufficiently precise official rate, which is a source of considerable distortions
For over a year now, statistics have shown an unusual rise in the general price level as calculated by the Consumer Price Index (CPI). The highest seen in 40 years, this increase has fuelled public debate as well as anxiety among Canadians. Researchers at the MEI believe that the actual deterioration in purchasing power is much more pronounced than the official rate would indicate, and they challenge the validity of the metrics employed by Statistics Canada which in their view do not reflect the true inflationary pressure experienced since the beginning of this year.
 Related Content
 |
 |
 |
| Mieux mesurer l’inflation afin de la combattre (Le Journal de Montréal, September 7, 2022)
To fight inflation, measure it better (Sun Media Papers, September 7, 2022) Le taux officiel d’inflation est un «thermomètre mal calibré», estime l’IEDM (Le Journal de Montréal, September 7, 2022) Now more than ever, Statscan needs to re-examine how it measures inflation (The Globe and Mail, September 12, 2022) Official inflation rate misleading, situation actually worse: MEI (The Suburban, September 14, 2022) |
Interview (in French) with Nathalie Elgrably-Lévy (Yasmine Abdelfadel, QUB radio, September 7, 2022) |
This Economic Note was prepared by Valentin Petkantchin, Vice President, Research at the MEI, and Nathalie Elgrably-Lévy, Senior Economist at the MEI. The MEI’s Taxation Series aims to shine a light on the fiscal policies of governments and to study their effect on economic growth and the standard of living of citizens.
For over a year now, statistics have shown an unusual increase in overall prices as measured by the consumer price index (CPI). This increase is the subject of much public debate and has been weighing on Canadians’ minds, particularly as it is the highest increase in almost 40 years.(1)
Rising prices and reduced purchasing power are mentioned in the media on an almost daily basis, and surveys conducted in the summer of 2022 show that Quebecers and other Canadians are particularly sensitive to this issue. For instance:
- An August 2 SOM-Le Soleil survey found that 87% of Quebecers are worried about rising prices.(2)
- An Angus Reid survey conducted between July 18 and 21 found that nearly 75% of Canadian respondents were reluctant to make a major purchase, such as a car or a house. This represents a clear increase over 2020, when only 56% felt this way.(3)
- A July 12 Léger survey found that over 80% of Canadian respondents think prices will continue to go up.(4)
- Finally, a Scotiabank survey published on July 25 showed that over half (53%) of Canadians are concerned about their ability to pay for day-to-day expenses.(5)
However, even though the official rate of inflation, as calculated by Statistics Canada and reported by the media, is already the highest in the past forty years, the calculation method used does not reflect the real inflationary pressures recorded since the beginning of the year. Concretely, the erosion of purchasing power is much more pronounced than the official rate published in the media indicates.
The Official Rate Is a Poorly Calibrated “Thermometer”
The official rate corresponds to the change in the consumer price index (CPI) over the previous 12 months. This indicator occupies a prominent place in the Statistics Canada Prices Portal, as well as in the public debate,(6) whether the price variation is upward or, much more rarely and sporadically, downward.
For example, this is how a mainstream media outlet described the most recent data on rising prices (or inflation(7)): “The Canadian inflation rate slowed in July 2022 to 7.6% year over year. This is down from the 8.1% observed the month before (…).”(8)
Based on Statistics Canada’s calculation method, the CPI went up by 7.6% between July 2021 and July 2022. Note that this rate is already nearly four times higher than the Bank of Canada’s 2% target.(9) However, despite its popularity, this year-over-year rate of change in the CPI provides very limited information on the inflation we are currently experiencing.
Looking Backward, Not Forward
The inflation rate is focused on the past. It is a solely retrospective rate, reporting what has happened over the past year, with no distinction of when exactly the variation took place: a year ago, several months ago, or more recently?
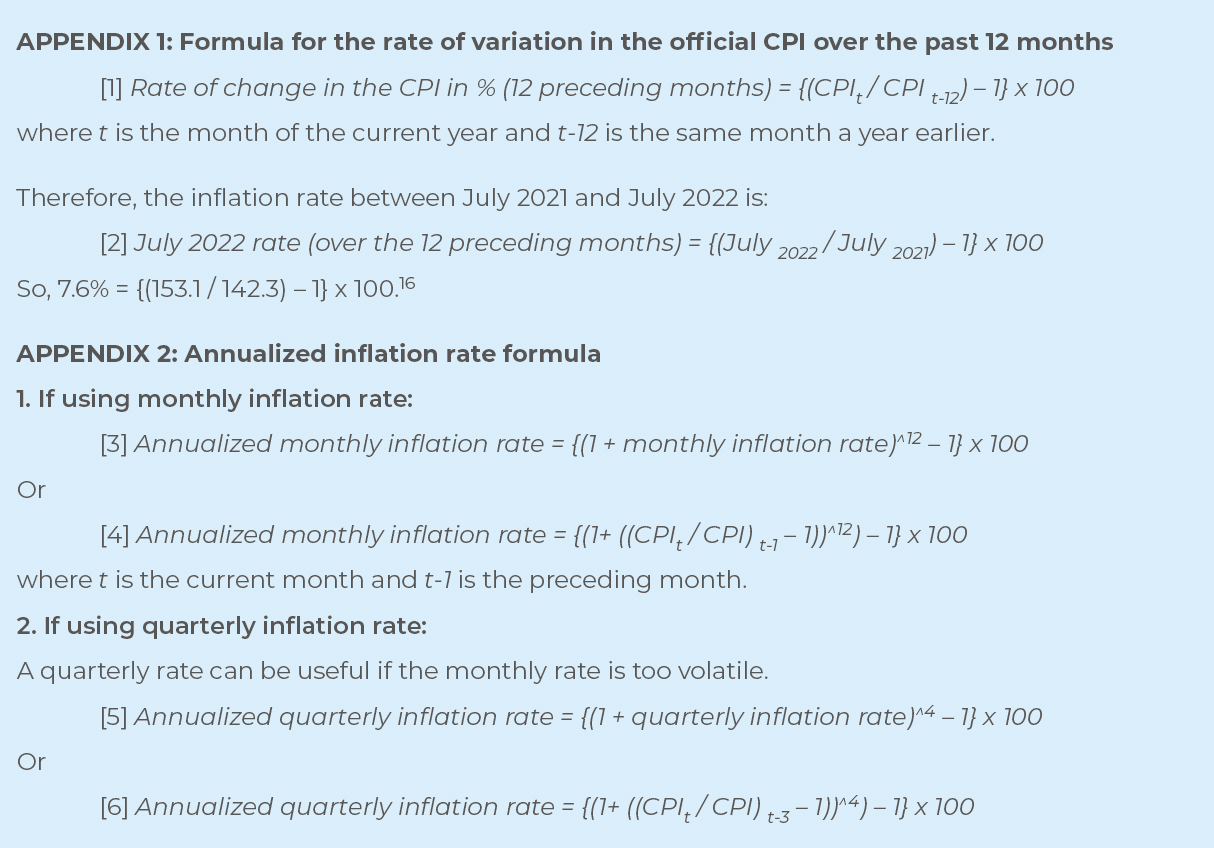
Because of the way it is calculated (see Appendix 1), the backward-looking rate tells us about the loss of purchasing power already recorded, and paints the entire past year with a broad brush. This information is not without interest, but it is useless for determining the current trend because it is possible, or even highly probable, that today’s context is different from last year’s.
The backward-looking inflation rate thus does not accurately reflect current inflationary pressures and fails to tell us about the extent of inflation over the preceding month or quarter,(10) a failure that is all the more important if the situation now is significantly different than it was a year ago.
Focusing on the official backward-looking rate is like knowing the average speed of a car over the past hour. It tells you the distance the car covered in that hour, but it says nothing about its current speed—for that, one need only look at the speedometer—and it does not help predict the distance that the car will travel in the next hour if it maintains this speed. The speedometer, on the other hand, does provide this information, and that is what it is for: If it shows a speed of 120 km/h, it immediately conveys the information that 120 km will have been traversed in the next hour if this speed is maintained.
The same is true of the backward-looking rate. It indicates how much the cost of living has gone up over the past 12 months, ignoring the fluctuations over this period. But this information does not shed any light on the current acceleration of inflation, nor on what will happen to purchasing power over the next year if the current inflationary “speed” (current month or quarter) were maintained.
The backward-looking official rate therefore has a major flaw that limits its ability to assess current inflationary pressures. Another type of indicator, one that focuses on the future, can fill in these gaps.
A Forward-Looking Vision Based on Current Inflationary Pressures
Instead of calculating the purchasing power lost over an entire year, the forward-looking CPI growth rate aims to tell us about the loss of purchasing power due to the inflation rate over the past month or quarter, for comparison purposes, on an annualized basis, which is to say, if this inflationary pressure were to persist over the next year. This is a compounded and annualized rate, also called the effective rate (see Appendix 2 for how to calculate it).
Annualizing rates is nothing exceptional. It is common practice in financial and banking circles when evaluating and comparing investment performance, for instance.
Thus, if a banking institution offers an investment with a return of 1% per month, renewable every 30 days, capital and interest, the annualized rate will tell us about the growth of the capital invested after 12 months. Of course, it would be a mistake to think that the investment pays 12% per year (1% x 12 months). As the investment is renewed each month, capital and interest, it records growth on the previous growth, not only on the starting capital. The effective rate of return will therefore be 12.7% (see formulas [3] and [4] in Appendix 2).
Since CPI growth follows the same logic as the example above regarding the effective return on an investment, rigour demands that we calculate a compounded and annualized (or effective) CPI growth rate in order to obtain an accurate measure of how our purchasing power is trending.
Returning to our car analogy, instead of looking at the average speed and the number of kilometres covered over the past hour, the distance that will be travelled is extrapolated based on the current speed being maintained over the next hour. As mentioned above, this information is provided by the speedometer, in a simple and standardized format (km/h).
Therefore, in order to obtain a measure that is more representative of reality, the backward-looking price increase calculations should be replaced by a forward-looking indicator. That way, instead of focusing on the loss of purchasing power over the past year, we will be informed about the inflationary pressures we are currently experiencing by extrapolating them on an annual basis, that is to say, over the next 12 months.
The Information Statistics Canada No Longer Shows You
This kind of calculation is nothing new. In fact, it used to be published in both the United States and Canada.
US economist Joseph Salerno recently pointed out that the Federal Reserve published them regularly up until 1997.(11) Unfortunately, starting that year, “[g]one was any presentation of compounded annual inflation rates, which facilitated a grasp of the inflation rate’s latest monthly or quarterly fluctuations.”
In Canada, Statistics Canada published a similar indicator until 2007, called the “Consumer Price Index (CPI), three-month seasonally adjusted cumulative movement compounded to an annual rate.”(12) Jargon aside, it’s the exact same type of indicator that shows the current inflationary “temperature” by annualizing the quarterly CPI rate.
It is unfortunate that Statistics Canada decided to stop publishing this highly useful indicator just before the financial crisis. We have therefore reconstructed it using the existing official data available.(13)
First, it indicates a much stronger inflationary pressure which started about two years ago, contrary to what the official indicator showed at the time (see Figure 1). Inflation was already well above the Bank of Canada’s 2% target in July 2020 (3.3%), and has remained at that level, often reaching more than twice the target, with a single exception (September 2020). Meanwhile, the official rate only started showing numbers above the target in April 2021 (3.4%), when it finally caught up with what the annualized quarterly rate had been showing for several months.
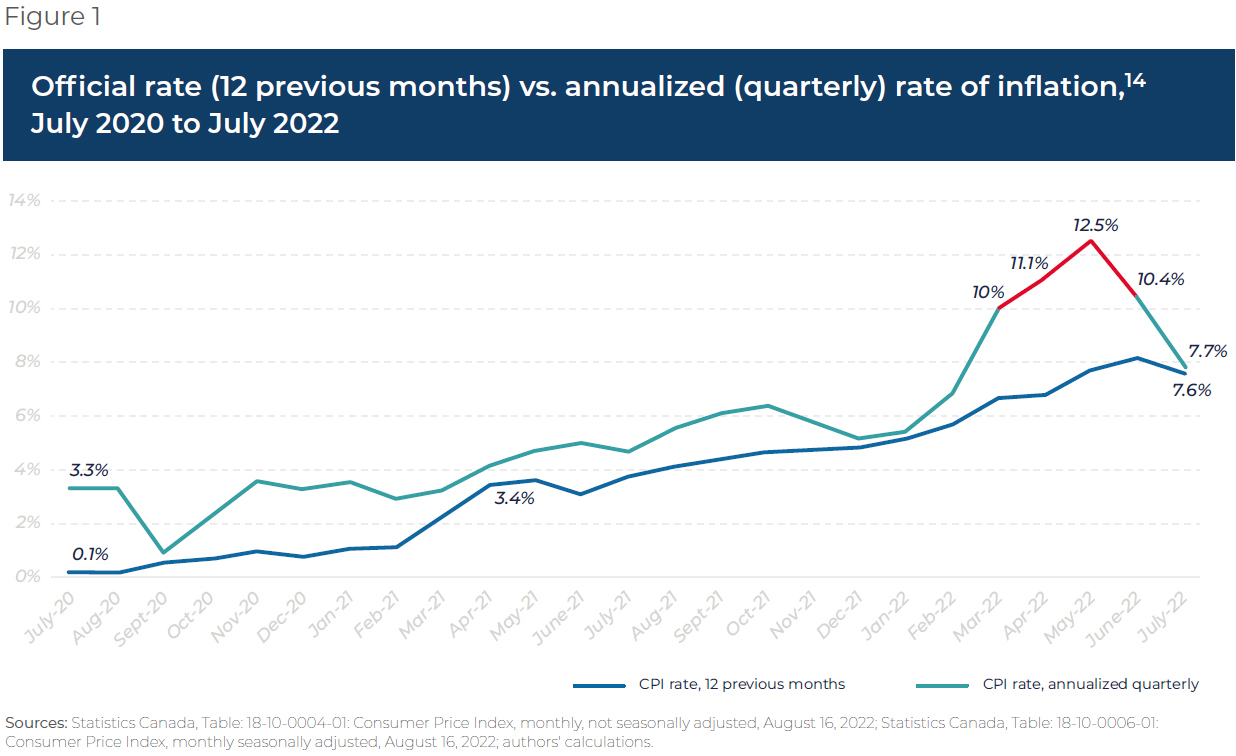
More generally, the annualized CPI rate is more volatile than the official rate. However, it has the advantage of flagging strong inflationary pressures earlier than the official rate, especially when it remains high, as it did throughout the second half of 2020. By consulting this indicator, we can thus move to correct monetary policy sooner, rather than waiting for the official rate to also exceed the 2% target months later.
Second, the annualized rate clearly shows that we experienced double-digit price inflation for several months (see the red part of the curve), namely between February and July 2022, when it fell back below 10% to 7.7%, a level slightly higher than the official rate of 7.6%.
This gap, sometimes substantial, between the backward-looking rate and the forward-looking annualized rate can certainly explain the disconnect that exists between Canadians’ perception of inflation and the official inflation rate. Both the Bank of Canada and Statistics Canada are aware of this phenomenon: “Current perceptions of the inflation rate for the past year, expectations of the inflation rate for one-year-ahead and five-years-ahead are consistently higher than the CPI inflation rate.”(15)
Summary
The official rate of price increases does not reflect current inflationary pressures. To get the pertinent information in this regard, the effective rate needs to be calculated, as Statistics Canada used to do before 2007. According to our calculations, this indicator points to rising prices already in the double digits for several months this year, reaching a high of 12.5% in May.
The systematic underestimation of inflation, due to the insufficiently precise official rate, is a source of considerable distortions, to the detriment of Canadian taxpayers, savers, investors, and retirees.
To resolve this lack of information, we need to annualize current rates (monthly or quarterly) in order to be able to consult a well-calibrated speedometer.
References
- Since 1983, see: Statistics Canada, “Consumer Price Index, June 2022,” Government of Canada, p. 1.
- Olivier Bossé and Émilie Pelletier, “Inflation : 87% des Québécois inquiets, les Québécoises encore plus,” Le Soleil, August 2, 2022.
- Agence QMI, “Inflation : le pouvoir d’achat des Canadiens mis à mal,” TVA Nouvelles, July 30, 2022.
- Sarah Ritchie, “Sondage : l’inflation inquiète et irritation des gens face à l’attente aux aéroports,” L’actualité, July 12, 2022.
- Scotiabank, “Les Canadiens sont préocuppés par leur capacité à assumer leurs dépenses courantes et par les répercussions de l’inflation sur leur capacité à épargner,” News release, July 25, 2022.
- Statistics Canada, Subject, Prices and price indexes portal, Consumer price index portal, August 16, 2022.
- Price inflation, as used to talk about rising prices and as appears in public debate, is one of the consequences of, and should be distinguished from, monetary inflation, which is the increase in money supply and credit in the economy.
- Authors’ translation. Agence QMI, “L’inflation passe à 7,6 % au Canada,” TVA Nouvelles, August 16, 2022.
- “The Bank of Canada aims to keep inflation at the 2 per cent midpoint of an inflation-control target range of 1 to 3 per cent. The inflation target is expressed as the year-over-year increase in the total consumer price index (CPI).” Bank of Canada, Core functions, Monetary policy, Inflation, Measures of inflation.
- Joseph T. Salerno, “‘Transitory’ No Longer: Double Digit Inflation Is Already Here!” Mises Wire, Mises Institute, July 22, 2022.
- Idem.
- Statistics Canada, Table 18-10-001901: Archived- Consumer Price Index (CPI), three-month seasonally adjusted cumulative movement compounded to an annual rate, 2001 basket content, April 20, 2017.
- Statistics Canada, Table: 18-10-0004-01: Consumer Price Index, monthly, not seasonally adjusted, August 16, 2022.
- Statistics Canada’s annualized quarterly indicator is seasonally adjusted, unlike the current official indicator (which is not seasonally adjusted), which has less of an impact as it is calculated over the past 12 months.
- Roobina Keshishbanoosy et al., “Consumer Price Index and Inflation Perceptions in Canada: Can measurement approaches or behavioral factors explain the gap?” Statistics Canada, p. 3.
- Statistics Canada, Table: 18-10-0004-01: Consumer Price Index, monthly, not seasonally adjusted, August 16, 2022.