Viewpoint – Is Ontario the New Quebec?

For decades, Quebec’s economy and the state of its public finances have been judged in comparison with Ontario. Catching up with its neighbour was a worthwhile goal, promoted by many. Over the past few years, the differences between the two most populous provinces have indeed been reduced. However, while the picture has improved somewhat in Quebec, including recent fiscal prudence on the part of the government, this narrowing of the gap does not so much reflect Quebec’s good performance as it does Ontario’s gradual decline.
Media release: After doubling its debt per capita, is Ontario the new Quebec?
 Links of interest
 |
 |
 |
|
More debt and poorer for it: Ontario is the new Quebec (National Post, August 11, 2016)
L'Ontario adopte les mauvaises habitudes du Québec (Le Soleil, August 11, 2016) |
Interview (in French) with Youri Chassin (Puisqu'il faut se lever, 98,5 FM, August 11, 2016)
Interview (in French) with Youri Chassin (Duhaime-Drainville le midi, FM93, August 16, 2016) |
Interview with Mark Milke (BNN, August 11, 2016) |
Viewpoint – Is Ontario the New Quebec?
For decades, Quebec’s economy and the state of its public finances have been judged in comparison with Ontario. Catching up with its neighbour was a worthwhile goal, promoted by many. Over the past few years, the differences between the two most populous provinces have indeed been reduced. However, while the picture has improved somewhat in Quebec, including recent fiscal prudence on the part of the government, this narrowing of the gap does not so much reflect Quebec’s good performance as it does Ontario’s gradual decline.
Canada’s largest province has been underperforming compared to the rest of Canada for some time now.(1) It even began receiving equalization payments in 2009, proof that Ontario had become more like Quebec in at least one way.(2) Today, there is even more evidence that Ontario is trending toward the Quebec model.
Ontario’s Public Finances
In 2002-03, Quebec’s program spending per capita was $5,659, somewhat higher than On-tario’s at $5,385. Ontario soon began to spend much more, though, eclipsing Quebec as of 2004-05. By 2015-16, Ontario was spending $8,765 per person on programs while Quebec spent $8,042.(3) Over the 13-year period, per person program spending in Quebec increased by 42.1% in nominal terms versus 62.8% in Ontario, with inflation over the period being 26.1%.(4)
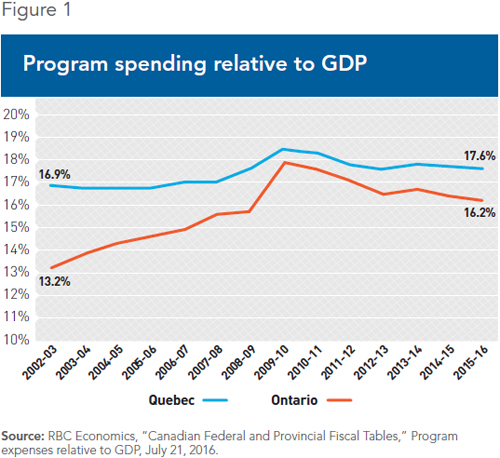
Relative to the size of their respective economies, Ontario has also been “catching up” over the past 13 years, and is on pace to surpass Quebec by 2022-23. In Quebec, program spending relative to GDP rose from 16.9% in 2002-03 to 17.6% by 2015-16, a 0.7-percentage-point increase. Ontario’s increase for the same years was from 13.2% to 16.2%, or 3.0 percentage points.(5) This general trend does seem to have reversed course somewhat over the past four years (see Figure 1).
In an attempt to deal with rising government spending and rising debt interest costs, the Ontario government has raised taxes, imitating Quebec yet again. Total provincial government revenues in Quebec rose from 18.5% of GDP in 2002-03 to 19.6% by 2015-16, a 1.1-percentage-point increase. In Ontario, the increase was more dramatic: Total revenues rose from 15.1% of GDP to 16.9% over the same period, a 1.8-percentage-point increase.(6)
Ontario is also inching closer to Quebec in terms of debt, which has increased by $163.5 billion since 2002-03, compared to Quebec’s increase of $91.5 billion.(7) On a per capita basis, net debt in 2002-03 was $12,847 in Quebec and $10,969 in Ontario. By 2015-16, Quebec’s net debt per capita had risen to $22,641 (or $9,794 higher per person), while Ontario’s net debt per capita rose slightly faster, almost doubling to $21,470 (or $10,501 more per person).(8) Relative to GDP, the two provinces’ debt ratios are also getting closer.
Real-Life Impact for Ontarians: Economic Growth and Jobs
Some might respond that Ontario’s higher spending “bought” desirable outcomes: higher economic growth, say, or more jobs. However, this is not evident when comparing Ontario to the national average, or to British Columbia, the country’s third most populous province.(9) Between 2002 and 2014, average annual economic growth was 2.1% in Quebec and 2.4% in Ontario, where demographic growth has been much stronger than in Quebec. Both provinces lagged behind the Canadian average of 2.6%, and behind B.C. where average annual economic growth was 2.8%.(10)
The number of people employed in Quebec and Ontario grew by 14.9% and 14.7% respectively between 2002 and 2015, well below the national average increase of 17.4% and British Columbia’s increase of 18.1% over the same period. Considered in another light, in Quebec and British Columbia, the number of people unemployed in 2015 declined relative to 2002, with 3,000 fewer people unemployed in Quebec and 30,600 fewer people unemployed in B.C. In contrast, 41,500 more people were unemployed in Ontario in 2015 compared with 2002.(11)
Median Family Income
The slow economic decline of Ontario relative to the Canadian average entails real consequences for its residents in terms of something most people can easily relate to: income. Total median family income grew by 43.2% in Quebec from 2002 to 2014, essentially the same as the Canadian average of 43.4% and not far behind British Columbia at 45.4%. In Ontario, however, this figure grew by only 32.2%.
Whereas in 2002, Ontario had an 8.4% edge over Canada as a whole in terms of total family income, this lead had completely disappeared by 2014. This poor performance can be explained by sluggish employment income. In Ontario, employment income barely kept pace with inflation, with all real gains coming from additional government transfers, which increased faster than in the rest of the country.(12)
The economic and fiscal policies of their government already hurt Ontarians, with the alleged positive economic impact of increased spending and borrowing not showing up in data for either GDP growth or employment growth. An equalization recipient, running deficits like there’s no tomorrow, and downgraded by credit rating agencies because of its debt load, the Ontario government is walking the path that put Quebecers at a disadvantage for decades. Once the economic engine of Canada, Ontario is fast becoming the laggard of Confederation.
This Viewpoint was prepared by Mark Milke, an independent policy analyst who holds a PhD in International Relations and Political Philosophy from the University of Calgary, and Youri Chassin, Economist and Research Director at the MEI. The MEI’s Taxation Series aims to shine a light on the fiscal policies of governments and to study their effect on economic growth and the standard of living of citizens.
References
1. Mark Milke, Go West, Young Adults: The 10-Year Western Boom in Investment, Jobs and Incomes, Fraser Institute, November 2014.
2. Department of Finance Canada, Federal Support to Ontario, October 30, 2015.
3. RBC Economics, “Canadian Federal and Provincial Fiscal Tables,” Program expenses per capita, July 21, 2016.
4. RBC Economics, “Canadian Federal and Provincial Fiscal Tables,” Program expenses relative to GDP, July 21, 2016; Statistics Canada, CANSIM Table 326-0022: Consumer Price Index, seasonally adjusted. Percentage calculation by authors.
5. Op. cit., endnote 3. Percentage calculation by authors.
6. Op. cit., endnote 4. Percentage calculation by authors.
7. RBC Economics, “Canadian Federal and Provincial Fiscal Tables,” Net debt, July 21, 2016.
8. RBC Economics, “Canadian Federal and Provincial Fiscal Tables,” Net debt per capita, July 21, 2016.
9. In British Columbia between 2002-03 and 2015-16, program spending, total spending, and net debt all decreased relative to GDP. Here are the numbers with the percentages from the earlier year first: program spending, from 19.5% to 18.6% of GDP; total spending, from 21.3% to 19.8% of GDP; net debt relative to GDP, from 19.5% to 16.2%.
10. Statistics Canada, CANSIM Table 384-0038: Gross domestic product, expenditure-based, provincial and territorial. The year 2014 is the most recent one for which there is available data.
11. Statistics Canada, CANSIM Table 282-0002: Labour force survey estimates (LFS), by sex and detailed age group, annual, 15 years and over.
12. Statistics Canada, CANSIM Table 111-0009: Family characteristics, summary. The year 2014 is the most recent one for which there is available data. For transfers, the data spans only from 2007 to 2014.