In 2013, the provinces that emitted the most GHGs per capita were Saskatchewan and Alberta, with 68 and 67 tonnes of CO2 equivalent respectively. These elevated figures are essentially due to the substantial amount of oil production in these two provinces. Indeed, 76% of oil produced in Canada is produced in Alberta, whereas Saskatchewan, which represents around 3% of the Canadian population, produces 15% of Canadian crude oil.(17) Quebec is the province that emits the lowest amounts of GHGs per capita, at 10 tonnes of CO2 equivalent, thanks to its extensive production of hydroelectricity (see Figure 1-7).
Figure 1-7
GHG emissions per capita, Canadian provinces, tonnes of CO2 equivalent
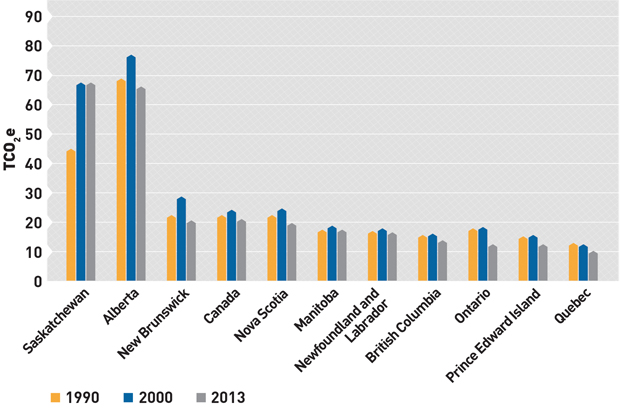
Sources: Government of Canada, National and Provincial/Territorial Greenhouse Gas Emission Tables, 1990-2013, August 24, 2015; Statistics Canada, CANSIM Table 051-0001: Estimates of population, by age group and sex for July 1, Canada, provinces and territories, 1990-2013.
Note
17. Statistics Canada, CANSIM Table 051-0001: Estimates of population, by age group and sex for July 1, Canada, provinces and territories, 2012; Statistics Canada, CANSIM Table 126-0001: Supply and disposition of crude oil and equivalent, annual (cubic metres), 2012.
< Back to Summary | < Back to the study’s page
< Previous Questions & Answers | Next Questions & Answers >